
Revolutionize your paper manufacturing with AI-driven optimization. Enhance efficiency, cut costs, and achieve autonomous operations like industry leaders Arjowiggins and Oji Paper. Embrace the future of smarter production!
Learn more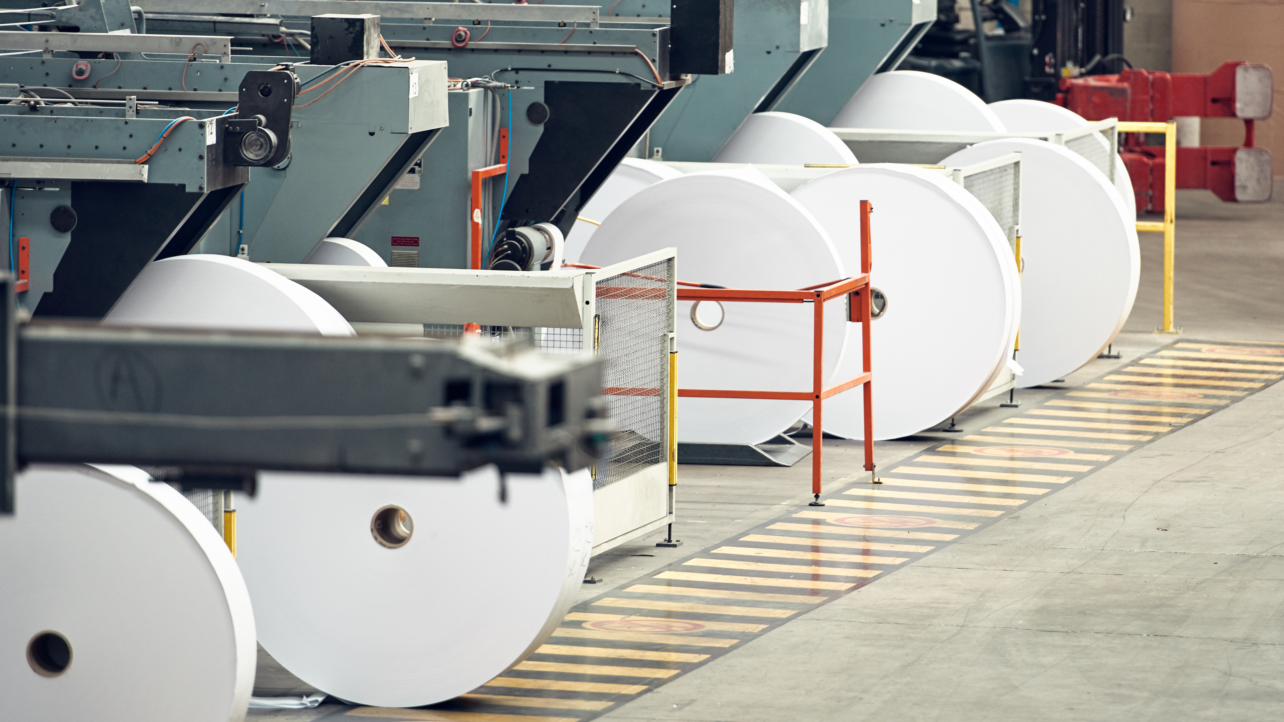


'/%3E%3Cmask id='mask0_48_2551' style='mask-type:alpha' maskUnits='userSpaceOnUse' x='0' y='0' width='24' height='24'%3E%3Crect width='24' height='24' fill='url(%23pattern1)'/%3E%3C/mask%3E%3Cg mask='url(%23mask0_48_2551)'%3E%3Crect width='24' height='24' fill='%23173B57'/%3E%3C/g%3E%3Cdefs%3E%3Cpattern id='pattern0' patternContentUnits='objectBoundingBox' width='1' height='1'%3E%3Cuse xlink:href='%23image0_48_2551' transform='scale(0.00195312)'/%3E%3C/pattern%3E%3Cpattern id='pattern1' patternContentUnits='objectBoundingBox' width='1' height='1'%3E%3Cuse xlink:href='%23image0_48_2551' transform='scale(0.00195312)'/%3E%3C/pattern%3E%3Cimage id='image0_48_2551' width='512' height='512' xlink:href='data:image/png;base64,iVBORw0KGgoAAAANSUhEUgAAAgAAAAIACAYAAAD0eNT6AAAAAXNSR0IArs4c6QAAQABJREFUeAHtnQncrtW4uNtSNCdDk1KKSlQojZqdqJQ0KJUKFXFw4pjSX3WIg0yng4ijMkQKTUTD1rQbqN1M80iTJk27du3/det9trdvv9/3vcMzr2v9fvf3zGvd97XW99z3u571rGfKrFmz5jJJQAISkIAEJJAWgeekZa7WSkACEpCABCQQBAwAbAcSkIAEJCCBBAkYACRY6ZosAQlIQAISMACwDUhAAhKQgAQSJGAAkGCla7IEJCABCUjAAMA2IAEJSEACEkiQgAFAgpWuyRKQgAQkIAEDANuABCQgAQlIIEECBgAJVromS0ACEpCABAwAbAMSkIAEJCCBBAkYACRY6ZosAQlIQAISMACwDUhAAhKQgAQSJGAAkGCla7IEJCABCUjAAMA2IAEJSEACEkiQgAFAgpWuyRKQgAQkIAEDANuABCQgAQlIIEECBgAJVromS0ACEpCABAwAbAMSkIAEJCCBBAkYACRY6ZosAQlIQAISMACwDUhAAhKQgAQSJGAAkGCla7IEJCABCUjAAMA2IAEJSEACEkiQgAFAgpWuyRKQgAQkIAEDANuABCQgAQlIIEECBgAJVromS0ACEpCABAwAbAMSkIAEJCCBBAkYACRY6ZosAQlIQAISMACwDUhAAhKQgAQSJGAAkGCla7IEJCABCUjAAMA2IAEJSEACEkiQgAFAgpWuyRKQgAQkIAEDANuABCQgAQlIIEECBgAJVromS0ACEpCABAwAbAMSkIAEJCCBBAkYACRY6ZosAQlIQAISMACwDUhAAhKQgAQSJGAAkGCla7IEJCABCUjAAMA2IAEJSEACEkiQgAFAgpWuyRKQgAQkIAEDANuABCQgAQlIIEECBgAJVromS0ACEpCABAwAbAMSkIAEJCCBBAkYACRY6ZosAQlIQAISMACwDUhAAhKQgAQSJGAAkGCla7IEJCABCUjAAMA2IAEJSEACEkiQgAFAgpWuyRKQQL0ITJky5bn10khtUiAwZdasWSnYqY0SkIAECieAI5+HQlZAVkJeibwIWQhZsLMcu55tRwDwJPKPjjzctZ7ty5YPcewG5GrkOu7hT7A0SWBgAgYAAyPzAglIIHUCOPqXwCCc/Fh5OfvK/DX/FOVlwcA1rIdEYPBnAoNHWJokMC4BA4Bx0XhAAhKQwFxz4eynwOE1yKYdWZ/lYkidU3Tt3oZcgZyFnI5cTlBgly8gTM8QMACwJUhAAhIYQwCfH933mcPfhPXoym96ugcDzkAiGDidWOCWphuk/qMRMAAYjZ9XS0ACLSCAw38BZmyDbIaE418aaXu6HgP/GQywPIuA4L62G6x9zyZgAPBsHm5JQAKJEMDpx4C9tyDvQrZGnoekmp7G8HhU8APkBIKBx1MFkZLdBgAp1ba2SkAC8Ux/LTCE098ZaUPXft61+iAZ/hT5AYHAxXlnbn71IWAAUJ+6UBMJSKAgAjj9Zcl6N2R3ZOWCimljtldhVPQK/Ihg4O42Gth0m2jbS1E3fx3GDgOAYah5jQQk0AgC3BxjAN+nkM2RGM1vGo5AzFFwChLBwKk4nHj90FQhAdp2vHL6OeQG6uPAYVQxABiGmtdIQAK1JsDNMZ7pfxpZt9aKNlO5v6D2IcixOJ6nm2lCc7Wmbb8Y7cPhvw+JcSwrUQ/Xshw4GQAMjMwLJCCBOhLgxvgc9NoBCce/eh11bJlOMenQwchxBgLF1yztewFK+SjyMSRmkIx0AeyHDnLjH8YkAQlIoLEEuDHOg+yFAeGQfobo/MupzVUo5ljkcvjvgPiIpQDuYI32vR9Z34BEwJU5/yjtqPgzbLIHYFhyXicBCVRKgJvi3CiwNxLP+GOQn6laAjHr4EHIL/lV6oyDI9YF7TsCqh2RzyMr9shuBvuWBPX9PY71tcsegL4weZIEJFAnAtwb10GfPyLfRnT+9aicmC75eOQS6mfLeqjUTC3gtymaX4REj1Yv5x+GnTSK848MDACCgkkCEmgEAW6MiyHfRdnzkTUaoXR6Ska9nEI9/RxZPD3zh7cYXmsgvyWHM5A1J8lppO7/yNtHAJMQ9rAEJFA9AW6K0R26J/IlxMl7gNCQFN3T/8kv1e83RN9K1KR5L0/B/4W8E4m2Plm6mxOWhuvMyU6c6Lg9ABPR8ZgEJFA5AW6O0bV8DhLvoOv8K6+RgRSIbywcSR2eibxioCsTOBkmayE/wtR4tXJXpB/nH2RiYqaRnH9kYg9AUDBJQAK1I8CNcUGUOhj5EPLc2imoQoMSiO8LRH1+JQ/nNWjhdTmfdh1teQfkw0iMZRk0xaRMK8DwtkEvHHu+AcBYIm5LQAKVE+Am+VqUiAFQ/mqsvDZyV+AyctwbB5bUdwZo09F7tQ+yHzLK1ybjGw3vIY+RU60eAQBoT2Sxka0yAwlIoLEEuAfEDXIaovNvbC1OqHjM0zCNej4UmXvCM1twEBtXQ47ElPjFHq/0jeL8Y+bFLyK5pNr0AABoESy6GbkceRMRzhMsTRKQQCIEOveAuFFG96gpDQKnY+Yu3O/vbZO5tOX4cf1WJLr5N8nRtph+eZe88qtTD8BHMGpRZEPEEaN51bD5SKABBLhhromalyA6/wbUV44qbk5ef6L+X59jnpVlFUEssj8KXI/8CsnT+cfkSociuaVa9AAENCy6GYkAIEsHEenEgBGTBCTQYgL8/8evpHi9b94Wm6lpExOIAYL7cc//v4lPq+dR2vAr0SwGq+6BxODVItKJ8Nk2z4zrEgD8P4zq5ex3w+Af52mweUlAAvUgwE0zXhGLG36uN7V6WKcWQxI4gus+xH2/9o+Aab8xydH2yE5I9FxPQYpM68DlwjwLqDwAAGKvX/+ZjdEINsfoc7IdLiUggeYT4P9+Waw4DVm5+dZoQc4ELiC/Hbjv35FzviNnR7t9CZm8HQmnvxFS1mP0M+ARj0tyTXUIAA7EokMmsOrvHFsX46+b4BwPSUACDSHATfRVqBrO/6UNUVk1yydwN0XuyH3/7PKLfnaJtNcXs6fb6Zf95sIsyl8fFvFmTK6p0gAAsAtjzc1IdAVOlML5RxAQwYBJAhJoKAH+59dF9ZORxRpqgmqXR2AGRUUQcFJ5RT5TEu30Raxth8Qv/RjIV7bTp8jZ6SgY7Dl7K8eVqgOAyX79d5sajwHicUDtnw11K+26BCTwDAFuqluydhwyv0wk0CeBJzlvV+770W4KTbTPF1JAt9Ovw+yTD6DTStgfPSK5p8oCAGD3++u/2+gfA2K37h2uS0AC9SfA//vuaPkDpA431foDU8NuAk+xsRf3/mO6d+axTruM7v14Xz9+6W+G1K19/jt2H45ehaQqjY1XJibr+h9r9K5U2PUAOWjsAbclIIF6EuB/9qNo9mWk6FHS9QSgVqMSiO73H9KO5uPe/91RMiOPGHcSI/YzWWWU/Aq+djr5f7vIMirpAaAShvn1383hXUVEg90FuC4BCYxOgP/1mLb0E6PnZA4S+CeBj3Dv/0a/LGh/K3Ju5uxjuXy/11Z8Xgz82wBbzy9Sj6p6AN6DUYP++u/m8H0q9gHglD44pFsJ1yUggfEJ8D8aY3x0/uMj8sjgBL5Ou4qegDnmw2d/9DC9Cul2+EsNXkQtrji6aOcfVlbVA/BHyn79iJhjhOhWQDpjxHy8XAISyJkA9+J9yPKInLM1OwlkBOLV8ZA1kMzhv5H1GMjX9FTowL9uOKUHANwYoksmr3f6HyGvfysjUuqG5roEJDA+Af7HYyR1jNqOZ7cmCRRF4FEybuMbJfvi00Ya69Av8Of0e2KO5+2SY14LkNep3HBel2OeZiUBCQxJgP/F+DX2E0TnPyRDL+ubQBud/6/Kcv5BuYoegKsoN57T5JniU5IbAy7yNklAAhUQwPmvRrExc1tM722SgAQGIxBTH6+GH7tvsMuGP7vUHoDODSJv5x/Wx6xNvyf/eLxgkoAESibA/16Mrv4tovMvmb3FtYLA01gRH78rzfkHtVIDAMrLs/s/9O9OS7JxOjeiZbp3ui4BCRRLgP+5mEzlNCT+B00SkMDgBL6I8586+GWjXVHqIwBuFDeh7nKjqTzp1THAcENg3jnpmZ4gAQmMRID/6XnI4A/IuiNl5MUSSJdAfP3wjfismWUjKK0HgBvFOhi3XAkGvoIy4nGAHxspAbZFJE/gUAjo/JNvBgIYksBDXPfOKpx/6FtaAEBZu0SBJaVXU85pBAEx46BJAhIogAD/X1uTbUzza5KABIYj8H6cf/SMV5JKeQTAjSICjRjhuETJVp5LeVsAON4XNUlAAjkR4H86xtrEXOX2tOXE1GySI/A1fNP+VVpdVg/AxhhZtvMPrhsgv+FmtVBsmCQggdEJ8P8UU4j/DNH5j47THNIkcDxmf6xq08sKAMrs/h/LNCYmOYObljersWTclsBwBHzuPxw3r5JAEDgfiVf+4tW/SlNZjwD+hpVV9AB0w72CjTcB/a7una5LQAL9EyCQ3oqzT0Km9H+VZ0pAAh0C17JcDz/09zoQKTwA4IYR31++rQ7GokO8IrgZ8OuiT02wqIYEJifA/3I8978UacMHVyY32DMkkC+Be8huHfzPjflmO3xuZTwCWHN49XK/Ml4RPJcbmTMG5o7WDBMgcDQ26vwTqGhNzJ1ADETfuk7OPywsIwBYK3eUo2W4LJefQxAQrwqaJCCBPgjw/7I7p23cx6meIgEJPJtAPOuPd/0vevbu6rfKCADq1AOQEY/xCFO5qdVRt0xHlxKoBQH+T2J+/y/XQhmVkECzCDyFunvh/H9dR7VTDQCiLqIrM94OeGMdK0adJFAjAp9Dl8VrpI+qSKAJBJ5EyZ1x/kfXTVn83mrIroUOAqSA5TG8NgMexqmEeDazHZX0u3GOu1sCyRLgf/h1GB9dl3MnC0HDJTA4gce5ZAf8yimDX1rMFfwvz0/O70D2QVZG1ogJPYpMdXv+38vWgHIScN5BZf2q1wnuk0CKBPifiFf9voXo/FNsANo8LIFHuHAb/MmZw2aQ53X8G69GfuH0d0Oyz3Vvj363FP0IoCnP2OcFzHGAehdLkwQk8AyB97JYWxgSkEDfBB7kzJhvplLnjy+bH9kLmYY+lyEfQDLn/y30O4HtuYp+BBAQNomCGpQOAc5nG6SvqkogdwLcOGKMzF8QX/vLna4ZtpTAvdgV3565pCr7+L/t9Wu/W50IBmIugnhEUVwAgCLRffgAsnAU1LD0E/R9N5BmNExv1ZVALgT49z2SjN6TS2ZmIoH2E7gdE8P5X122qfyvdj/bX2eC8uPRxJro+OfsnMJ6AFBqJQqZXVBWYIOW56Hr24AVUZ1JAskQ6Pzvxo2s6EeEyTDV0FYTOBvrdsRX3F2WlfyPLkpZ8Tnu7ZAtkAWQyVK8jvjD7pOKHATYlOf/3Ty619dn4wJAbwW06Ao1SSAVAp/GUJ1/KrWtnaMQOJyL/wMfMXOUTPq5Fl+0NOdti4TT3wiZB+k3/Wis848LDQAmxrcCh6cB/u3AmzrxqR6VQPMJ0Nbj1d13Nt8SLZBAoQTi8fD7ejnVPEvl/zF60sPhh8RbdfFofdAU38B5f6+LigwA4iNAbUgvwIjfURF7U9lHtcEgbZDABAQ+wbEi7wsTFO0hCTSCwO1oGT8KL85bW/xMOPjoPc+cfryvP0qKQCVecX+4VyZF/qOH42xLiq6WH1I38TGhA4E5qy2GaYcEMgK07+hi3DPbdikBCcxB4Bz2xPP+3D4rz/9dvJ63HrIV8jYk/g/zSh9H10vHy8wAYDwyvfcfwO4VqbA9gfrP1yh6n+ZeCTSSwMfQ+nmN1FylJVAsgfjR9w0kHOqToxSF/1iK6zdAYhr6WMare0WMuTkRXb9J3uOmIt8CuJFS43liG9M0jNoWuPe00ThtSo8AN6UXY/XNSLxSZJKABP5F4HpW38P9Pkb7D5z434pu/MzZh8N/+cCZDH7BbVyyBjrfN9Gl9gBMRGf8Y+tyKN4QiCDgyvFP84gEGkNgfzTV+TemulS0BAJPU0b8gj6A+3x8M2bShE8Inxrfz+h2+C+a9MJ8T3iK7OLzwxM6/yiykB4AIER3RnSTFNGtEXrXJUWjiJGgx9RFIfWQwKAE+H+Nd4pvQZo4adeg5nq+BPohcC0nxWRwMR9Mz8T/TXTlr4LEL/yQVyNvQKoOpGOc2ufQY9JUVA9ADGpou/MPuFHRR9MQ1mf5YaDHiEuTBJpG4N0orPNvWq2pbxEE4lf/15Bwoo9xb48B4Csi4eC7nX1sL4TULZ2GQof2q1RRPQAvR4Eb+lWiJef9ETtidOjNLbFHMxIhwE3uMkxdLRFzNVMC4xF4ggM/RO5HMmcfvqyoH8pknWuK/+MN8UEP9ZtrUQFAPAP5U79KtOi8eOayOxVwaots0pQWE8D5r45501tsoqZJIAUCMehvXXzPHYMYW1Q3fZvmABiE52KcfDI31c8hRbEdRB/PlcBkBHaf7ASPS0ACtSbwINptOajzD4uKclKpBgDBNGZyivkCYvbAeLXKJIFaEqB9zo1iu9ZSOZWSgAT6IRCPLbbD+Q/1NpoBQD+IhztnMy67lJvsesNd7lUSKJzAmyhhicJLsQAJSKAIAjE5UbypcNawmRsADEuuv+uW5rSpBAEf6e90z5JAqQTeVWppFiYBCeRJIOYn+PEoGRoAjEKvv2vn4bSvEQQch9TxtZH+rPCsVhGgLcZrfzHvuEkCEmgege/g/L8wqtpFBQCj6tXG63fAqMu48cZUkCYJVE0g2uN8VSth+RKQwMAETuaKDw58VY8LigoAHuhRlrue+TbCHwgCvojMKxAJVEjA0f8VwrdoCQxJID5BvDO//mO635GTAcDICAfOIJjHN9cvIgiIqSNNEiiVAO0uHkXZE1UqdQuTwMgE4gN7W+P8Hxk5p04GBgB5kRw8n5iA5Y/cjD+KFFUPg2vlFSkQ2BAjmzK7WQr1oY0SmIzA3znhLTj/uyc7cZDjRTkeHwH0Vwvx7fWvIGcQBLysv0s8SwIjE9h05BzMQAISKIvA4xQUX569Nu8CDQDyJjpcfhtz2eUEAb6WNRw/rxqMgAHAYLw8WwJVEXiagnfD+Z9XhAIGAEVQHS7PeC3rKIKAXyAvHC4Lr5LAxAQ6bSseP5kkIIH6E9gf5398UWoaABRFdvh8t+fSK7lRbzl8Fl4pgXEJbMyRmK7aJAEJ1JdAzPL3EZz/N4pU0QCgSLrD5x3Ts55CEPAdxMmDhufolXMSsPt/TibukUCdCES3/95FO/8wuJAAAMVnkHcMXDCNRmBfLr+GICB6BUwSyIOAAUAeFM1DAsUQmEm278SHfr+Y7J+dayEBQKcI3wR4Nutht+J7AjEuID4zvNywmXidBGg/S0JhZUlIQAK1JBA/nN+O8/9ZWdoZAJRFevRytiKLq7iJfxKJ7wuYJDAogU0GvcDzJSCBUgjE5D5b4fxPKqW0TiEGAGXSHr2s+ckiPgARnxl2JrfReaaWwxqpGay9EmgAgQfR8d9w/meUrWuRAUCuMxaVDabm5a2KfmcTBByJLFZzXVWvPgRWqo8qaiIBCUDgXmQTnP/5VdAoMgC4ogqDEiozXuV6D/IXgoA9ErJbU4cn4PP/4dl5pQTyJvBXMtwQ539p3hn3m1+RAUBlRvVrfEvOexF2/JAgYCriDb4llZq3GbSNmPv/5Xnna34SkMBQBG7mqjfi/K8Z6uqcLjIAyAlkDbLZCB0u40b/OcTvvNegQmqmwgro4weAalYpqpMkgb9gdTj/G6u2vsgA4CaMi8ENpvIIzEtRByDXEQTshRRZv+VZZUl5EPD5fx4UzUMCoxG4jMuj2//20bLJ5+rCHAQGxlSG0/NR01wGJBBzB/wAmU4Q8JYBr/X0dhIwAGhnvWpVcwhciKox4K82A+QLCwA6deI4gGob52so/lSCgNOR11ariqVXTMAAoOIKsPikCZyF9Zvj/O+vEwUDgDrVRnG6bEbWfyIIOAZ5WXHFmHONCRgA1LhyVK3VBP4X67bA+T9cNyuLDgB8BFCfGo/XBndD4rXBLyOL1kc1NSmBgAFACZAtQgJdBOJ7OHvi+D+IPNm1vzarU1CsMGVwMjHqOKKe5xVWiBkPS+A+Lvw8cjht4IlhM/G6+hPg/zBmkIypRk0SkEA5BG6hmJjX/5JyihuulEJ7ADA+vmx05XCqeVXBBGIGwcOQP+MgdkGih8DUTgJ+Urqd9apV9SQQU/quWXfnH+gKDQA6deNAwA6Imi6WR6+fIH8kBtjWQKCmtTSaWgYAo/Hzagn0S+DLnBjP+2OK39onA4DaV1FpCr6Okn6FxGRCOyNltI3SjEu8IAOAxBuA5hdOIB6x7YTj/zjyVOGl5VRAGTf5ePfR1BwCr0HVnyLXEATshfjp4ebU3XiaLjjeAfdLQAIjE7iOHNbG8R83ck4lZ1B4AACUP2FTDIgwNYvAK1E3JhOKWQXfjziQs1n1162tPQDdNFyXQH4ETiartfBzV+WXZXk5FR4AdEw5vjyTLClnAjFvwLeQmwgC9kcWyDl/syuegAFA8YwtIS0C8frcQcg2OP/GTnlvAJBWox3F2iW5+DDkZoKATyOLjJKZ15ZKwEcApeK2sJYTCIcfjv9gpLj36EuAWFYAMA1b7ijBHosonsCLKCLmD7iFIOC/kBcWX6QljEjAHoARAXq5BDoEoqs/uvyj67/xqZQAoBMlndB4WhrQTSB6AD6D3EoQ8D1kje6DrteKgAFArapDZRpK4Hz0jsF+MeivFamUAKBD6hetIKYRYwnELHPvRS4lCDgXiUmFfHNgLKVqt30EUC1/S28HgWtw/q2aUbPMAOBc2sBd7WgHWjEOgfXZH5MKRa/AIcjS45zn7nIJNPo5ZbmoLE0C4xKYd9wjDT1QWgBA5PQ0jHwM0NCGMqDaS3D+gUgMGDwO2XjA6z09XwIP5ZuduUkgSQKt69ksLQDoNJfjk2w26RodH4PaATmLIOBKJOYTsDu6/PbQ2NeUykdliRIYl4ABwLho+jswldPu7e9Uz2oZgVWxJ+YTuIMg4JvISi2zr87m2ANQ59pRt6YQMAAYpaZ4DBBzJMd886Z0CSyM6f+OxFcIY9Dgvkh8mdBUHAF7AIpja87pEHAMQA51/fMc8jCLdhCIQYPfQf5GEPBLZHvEKYfzr1t7APJnao7pEbAHIIc6P508rs4hH7NoD4GIrN+GxKuidxIEfBfZEJnSHhMrtcQegErxW3hLCBgAjFqRPAaIV5L+e9R8vL61BBbFsr2RPyDxFsGhyKtaa205htkDUA5nS2k3gdY9ApjyjD8ut9a4oUckdQOyTLklW1qDCVyC7j9CfkqbvbPBdpSuOv9vMX3zPaUXbIESaBeBP3HvWbNNJpX9GuA/2QHxSVYOaxNIbSmcwOso4avI7Ti03yHxSqEBZH/Y7QHoj5NnSWAiAq17BFBJD0AQ5uYdn5W9BfFjMgHENCyB6Vx4EhIf57iY4NJZ73qQ5P/tMXY/v8chd0lAAv0R+DO3l1X6O7UZZ1XSAxBoABlzKh/eDExqWWMCa6DbgciFyF9xdEci23YCzBqrXbpq9gKUjtwCW0bAHoA8K5SbdPz6j16A6A0wSSBPAo+T2ZlI9AycRMB5e56ZNy0v/teip2T1pumtvhKoEYGbuI+8vEb6jKxKZT0AoTkw/87iyJGtMAMJzEkguru3RGL2wdtwgPG1wvhA0VpIpe1+TlVL2XNlKaVYiATaS+CJtplW2RiADCQ34xjIdQPSuu6VzEaXtSMQ78XH1ynP7kiM7o2Bqa1N/J99EuO+0FoDNUwCxRO4kvvEa4ovprwS4mMtlSaAxq+zn6LEuypVxMJTIrAIxm7VkbD7EdrgNJZZQHAh7TIeIbQp2QPQptrUlioI2ANQBHVuvjHRS9ygnPmtCMDmOSiBGVxwERIBQUxIdD4BQQxabWzif2w5lL+psQaouASqJxA/DNapXo38NKj8EUBmSqcXYOds26UEakRgJrrEREQRDERPwXRuBI1ypvx/RXAdjz4WQkwSkMDgBM7h/37DwS+r7xV1CgCWBNM1SHTPmiRQdwLhTC9DYnR9SKxfxQ0ieg9qmYgBLkCxtWupnEpJoP4EzuT/e7P6q9m/hpWPAchUBWx8Ee5TbMeobZME6k4gAtX4NdD9i2AmbTiC2Cwo+GdgQNuOt13qkK5ACQOAOtSEOjSRQOvGANQmAOi0hu+wjMGArXrO0sSWrs5DEYj/pxglHLJ7lgNBwe2sZ0HBn1m/MYTA4K7snJKWDgQsCbTFtJJA694UqlUAwA1xFjfLfWg68by1Vrq1sjlrVFkEXkpBIVt3F0hbf5TtfwYDPZY38+/wWPf5OawbAOQA0SySJWAPQNFVz03vCm6Mh1HOJ4ouy/wlUDGB+Sn/1R0Zq0oEw39j59gAIfbd25G/DxgkGACMpey2BPon0LoegNoMAuyuA25887F9FbJ8937XJSCBOQhEL0IEBDHOYHZgMM56HL8ceQFikoAEBiNwNAH3HoNdUu+za9nNHr9qCAL2A91v6o1P7SRQOYHoRVi2I5UrowISaDGB1vUA1HZOdIKA39KQjm1xY9I0CUhAAhJoDoG8x+RUbnltA4AOmY+wfKBySiogAQlIQAKpE7ivbQBqHQDQCxCvSX2ybdC1RwISkIAEGkcgxtm0KtU6AOiQ/i7LE1tFXWMkIAEJSKBpBOwBKLvG6AWYRZm7IVeXXbblSUACEpCABDoEDACqaArEAP+g3G2R+6so3zIlIAEJSCB5AgYAVTUBgoDrKXtn5KmqdLBcCUhAAhJIloBjAKqseoKA31G+MwRWWQmWLQEJSCBNAq3rAajlTICTtS0mCTqac2Z/bGWy8z0uAQlIQAISGIFAjEWbhx+hreqBbmoA8Hwq42xkrREq1EslIAEJSEAC/RB4AOffuim0m/Aa4ByVQ0U8zs7tkDvnOOgOCUhAAhKQQL4EWtf9H3gaGQCE4gQBd7B4O9K6TzSGfSYJSEACEqgNgdYNAAyyjQ0AQnmCgGks4qNBJglIQAISkEBRBOwBKIrsKPkSBHyf6z82Sh5eKwEJSEACEpiAQHxKu3Wp0T0AWW0QBBzG+r8jMVLTJAEJSEACEsiTwG15ZlaXvFoRAARMgoDDWeyLPB3bJglIQAISkEBOBG7NKZ9aZZN7AMA7+puHVGElQcD3KHcvpFXvalbB0jIlIAEJSGA2AXsAZqOYeGVVDv+eIOACZOuJT83/KEHA0eS6KzIz/9zNUQISkIAEEiRgD0Cflf5o57y1WZ5EEDAd2RHJvbdhPH0IAn7GsR0RXxEcD5L7JSABCUigXwIGAH2SenjMeauz/XPkKoKAdyHPHXO8kE2CgF+RcUwWFJMGmSQgAQlIQALDEHgYf/LAMBfW/ZoifpWPDQAyBiuzchRyLUHAvsi82YGillTaqeT9ViTrlSiqKPOVgAQkIIF2Emjlr/+oqjIDgKxpLM/Kd5AbCQI+iiyRHShiSRBwOvm+BXmoiPzNUwISkIAEWk3AAGCA6h2vB2BsFkuz4yvIHQQBZyB7Iy8ce1Ie2wQBZ5PP65HpeeRnHhKQgAQkkAyBVr4BELVXRQ/A2FYTOmyKfBf5G0HAqUiMFVh47ImjbBMEXM/16yJHjpKP10pAAhKQQFIEbm2rtUUEAI+MAGsero3u+hgrcDdBwAnITsj8I+Q5+1KCgMeRvdmxB+K4gNlkXJGABCQggXEItLYHYAoOcRybh9uNs16MK/P+clIEFSchJyLT0PlmliMl9Iz5Cn6BxOBEkwQkIAEJSKAXgU3xOWf1OtD0fUUEADG6f0bBYO4i/wuRCzrLi6mgfwxaJkHAglwTjx52GfRaz5eABCQggSQIrIB/ubGNluYeAAQkHGu8M7lIicBi/v+rkCwoiMDgGiqtr+8CoG98UviryPMQkwQkIAEJSCAIxI/ZBfAlrZxevqgA4BKgvTboVZjitb8Y9X8HcucYiR6E2HdPFiQQBKzJ9nHIcohJAhKQgAQkcDk+Iiaza2Uqala+6C6pOgCItwg2nKTWnsLx38M5WYBwGevLIkUMjpxEFQ9LQAISkEDNCFxTM31yVafIACBXRQvKbG7yjYmICp2MqCDdzVYCEpCABIolcHWx2Vebe1G/dKMHwCQBCUhAAhJoMgEDgCFqzwBgCGheIgEJSEACtSLQ6kcARfUA3FSrKlQZCUhAAhKQwGAEZnL6dYNd0qyziwoAbgbD081CobYSkIAEJCCB2QSu5w2AJ2ZvtXClkAAAaE/C6vYW8tIkCUhAAhJIg0Cru/+jCgsJADpto/Xw0vgf0EoJSEACSRJo9QDAqNEiA4CYjc8kAQlIQAISaCIBA4ARam3aCNd6qQQkIAEJSKBKAq3vxS5kKuCoMWbYi28B3B+rsW2SgAQkIAEJNIRADGJfkPFsjzVE36HULOwRAOAeRKPWd6EMRd2LJCABCUigzgT+0nbnH/ALCwA6NetjgDo3cXWTgAQkIIFeBC7utbNt+4oOAM5vGzDtkYAEJCCB1hMwAMihiu0ByAGiWUhAAhKQQKkELiq1tIoKK2wQYNjDQMAYAPh35AWxbZKABCQgAQnUnEBMZLcQYwBm1FzPkdUr9BEAAGeh4dSRtTQDCUhAAhKQQDkELk/B+QfKQgOATl2dUE6dWYoEJCABCUhgZAJJPP8PSmUEACdTTnSpmCQgAQlIQAJ1J5DE8/+ohMIDALpSHqCcs+pe4+onAQlIQAISgIA9ADk3Ax8D5AzU7CQgAQlIIHcCj5Bj66cAzqgV3gPQKejXLGNqRZMEJCABCUigrgQuodf6qboql7depQQAAL0TxZ0TIO/aMz8JSEACEsiTQDLP/wNaKQFAp3Z+mWctmZcEJCABCUggZwLJPP8PboVOBNRdMcwJtDzbN3bvc10CEpCABCRQIwLL0mN9W430KVSV0noAgHoTlvg2QKHVaeYSkIAEJDAkgRtScv7BqLQAoFMh/ztkxXiZBCQgAQlIoEgCU4vMvI55lx0AxNsAt9cRhDpJQAISkEDSBJLroS41AKB7ZSbN64ikm5jGS0ACEpBAHQkkFwCUNggwq20GAy7O+q3IvNk+lxKQgAQkIIEKCVzLD9SVKiy/kqJL7QEIC4F8F4vjK7HWQiUgAQlIQAJzEpg656727yk9AOggPbz9aLVQAhKQgAQaQiC57v+ol9IfAWSNgUcBl7K+RrbtUgISkIAEJFARgSXpnY4Za5NKVfUABOQvJUVaYyUgAQlIoI4ErknR+UdFVBkAHEv5V9SxNaiTBCQgAQkkQ2BqMpaOMbSyAICIaxa6fGaMPm5KQAISkIAEyiSQ5PP/AFzZGICsdhkLcAHra2fbLiUgAQlIQAIlEYgfoovze/SeksqrVTGV9QB0UTiga91VCUhAAhKQQFkELk/V+QfgygMA4J+BHmeWVduWIwEJSEACEugQOCllEpUHAB349gKk3Aq1XQISkEA1BAwAquH+r1LpBYhxAElXxL9ouCYBCUhAAiUQiPf+Ly6hnNoWUZcegAD0MWRGbUmpmAQkIAEJtInAyfz4jEGAyabaBADUw7XUwueTrQkNl4AEJCCBMgmcWGZhdSyr8tcAu6HwSmB8IXA6skr3ftclIAEJSEACORJ4jLxeyA/PWCabatMDEDVAZTzBYp9YjW2TBCQgAQlIoAACp6fu/INprQKAUIhKOZfF92LdJAEJSEACEiiAQPLd/8G0Vo8AskrmUcCirF+DLJHtcykBCUhAAhLIgUD0MC/Fj814CyDpVLsegKgNKuYBFh9OumY0XgISkIAEiiBwsc7/Gay1DABCNSro5yzspnmmnvwrAQlIQAL5ENCvdDjW8hFAVsc8CliM9UuQl2X7XEpAAhKQgARGILA6PzAvH+H61lxa2x6AIEwl3cdiRyTeDjBJQAISkIAERiFwk87/X/hqHQCEmlRWTNW4/79Udk0CEpCABCQwFIFjh7qqpRfV+hFAN3MeB/yU7Z2797kuAQlIQAISGIDAavyovGKA81t9apMCgAWpiegNWLnVNaJxEpCABCRQBIGrcP6vLiLjpuZZ+0cAGVgq7mHWd0Aeyfa5lIAEJCABCfRJIHqRTV0EGhMAhM4EAVex2LtLf1clIAEJSEAC/RDw+f8YSo0KAEJ3goCI4j49xg43JSABCUhAAuMRuAjfccN4B1Pd37gAICqKivwCi8NTrTTtloAEJCCBgQjY/d8DV2MGAY7VnbcCIniJ2QK3H3vMbQlIQAISkECHwNMsX8oPx79J5NkEGtkDECZQmVGpuyJnx7ZJAhKQgAQk0IPAH3T+Paiwq7EBQJhDpc5gsS1yZWybJCABCUhAAmMI2P0/Bki22dhHAJkBseRxwNIspiHLxLZJAhKQgAQkAIEnkSX4sRjTypvGEGh0D0BmC5V7B+ubI7dl+1xKQAISkEDyBE7T+Y/fBloRAIR5VPK1LNZHYmmSgAQkIAEJ/FgE4xNoxSOAbvN4HPBitk9DXtu933UJSEACEkiKwL1YG6P/Y6yYqQeB1vQAZLZR2fewvglyTrbPpQQkIAEJJEfgKJ3/xHXeuh6AzFx6AuZj/RfIltk+lxKQgAQkkAyBlTqPhpMxeFBDW9cDkAGg4h9j/W2I8z9nUFxKQAISSIPAVJ3/5BXd2gAgTKcBxCsguyL/HdsmCUhAAhJIgsARSVg5opGtfQQwlguPBOJTwv+HLDj2mNsSkIAEJNAaAjH4b2l+AD7RGosKMqTVPQDdzGgMMR5gHeS67v2uS0ACEpBAqwj8UOffX30m0wOQ4aAnYBHWj0Hemu1zKQEJSEACrSHg4L8+qzKZHoCMB5Hhg6zH9wMOQmYhJglIQAISaAeBs7jHOxlcn3WZXAAQXGggkQ5mdRvEOaIDikkCEpBA8wl8t/kmlGdBco8AxqLlkcDi7Ps2st3YY25LQAISkEBjCDj4b8CqSrIHoJsRPQF3IW9n385INCCTBCQgAQk0j4CD/wass+R7ALp50RsQ3xH4FhKvDJokIAEJSKAZBJ5GzRj8d30z1K2Hlsn3AHRXA43nHmRH9oXc3X3MdQlIQAISqC2BX+v8B68bA4AezGhIMWfAqki8LuibAj0YuUsCEpBAjQgcViNdGqOKjwAmqSoeC7yOU76MbDrJqR6WgAQkIIHyCVzIj7aY5M00IAF7ACYBRsO6BNmM07ZCrpzkdA9LQAISkEC5BL5SbnHtKc0egAHqkt6ACJj2RA5BlkZMEpCABCRQHYGbKPoV/Eh7qjoVmluyPQAD1B2N7GnkB1zySuQzyEMDXO6pEpCABCSQL4Gv6/yHB2oPwPDs5qJHYGEufw/yIWQ5xCQBCUhAAuUQuJ9iliEAeKSc4tpXij0AI9QpDe8h5GtksSIScwecP0J2XioBCUhAAv0TOELn3z+sXmfaA9CLygj76BV4A5f/BxIBwXNHyMpLJSABCUigN4En2L08AcBfex92bz8EDAD6oTTEOQQCy3DZ+5BdkOWHyMJLJCABCUigN4GjcP579j7k3n4JGAD0S2qE8wgG1uLydyA7IREYmCQgAQlIYHgCqxEAXDH85V4ZBAwASmwHBAJTKG5dJIKBmG54ScQkAQlIQAL9E/gdzn+L/k/3zPEIGACMR6bg/cQCMQDzjciWyEbI6xHHDADBJAEJSGACAhsTAPxhguMe6pOAAUCfoIo+jYBgQcpYD4lgYGMkHhvMg5gkIAEJSOAZAmfi/GNmVlMOBAwAcoBYRBYEBPOT767I/sjKRZRhnhKQgAQaRmADAoDzGqZzbdW1y7kmVYPDXxZV1uySeCSwWE3UUw0JSEACVROIZ/86/xxrIYkeAJxrdBm9GrmuIzfRkGbmyHGgrNAnviMQzj6cfOb0XzxQJp4sAQlIIC0C63DfvjAtk4u1NpUAID7p+6culOH8b0aygCBb3s6+hzOhsc1gfdKEQ5+bkxZBXjCJLMXxcPpLICYJSEACEuiPwKncj+OLrKYcCSQRAAQvnPRVLF41ILsIFGYHBF3rs1hfFMkcfnwTIF7xM0lAAhKQQP4E1iIA+GP+2aadY0pjAH5EVR86YHUHn3D0ISYJSEACEiifwIk6/2Kgp9QDEIPsbkb8pV5MWzJXCUhAAnkTiN7W1xEATM87Y/Oba65kvgZIA7qVCj/bSpeABCQggcYQ+KXOv7i6SiYA6CA8pjiU5iwBCUhAAjkSiF//B+WYn1mNIZBaAPAL7H98DAM3JSABCUigfgSO49f/FfVTqz0aJRUA0JgepOp+1p7q0xIJSEACrSTwFFYd1ErLamRUUgFAh/tXasRfVSQgAQlIYE4CR/KD7Zo5d7snTwLJvAXQDY05AX7D9pu797kuAQlIQAK1IPAPtFiRAODuWmjTYiVS7AGI6vxyi+tU0yQgAQk0mcChOv9yqi/JHoBASy9ATA0cUwSbJCABCUigHgRuQY2VCQAcrF1CfaTaAxBoHQtQQgOzCAlIQAIDEPiUzn8AWiOemnIPQEzzez3yshEZerkEJCABCYxOIL70ty4BQLz/byqBQLI9ALSx+NCPvQAlNDKLkIAEJNAHgf11/n1QyvGUZHsAgiHjAOZhEa+arBDbJglIQAISqIRATPqzUyUlJ1xosj0AUec0uCdZfDLh+td0CUhAAlUTmIECn6haiRTLTzoAiAonCIjpgaelWPnaLAEJSKAGBP6H+/BNNdAjORWSfgSQ1TaPAtZj/bxs26UEJCABCZRC4F5KiUl/Ypp2U8kEku8BCN40vvNZHF8ye4uTgAQkkDqBg3T+1TUBewA67OkFWJHVq5EYGGiSgAQkIIFiCcRkbGsTAMSHf0wVELAHoAOdRhhzAhxeQR1YpAQkIIHUCITT30fnX221GwA8m/+BbDoY5dlM3JKABCSQN4Fv4vwvyTtT8xuMgI8AxvDiUcAm7DoDmTLmkJsSkIAEJDA6gdvI4lUEAA+PnpU5jELAHoAx9GiUZ7HriDG73ZSABCQggXwIfFDnnw/IUXOxB6AHQXoBFmL3lciyPQ67SwISkIAEhiNwAs5/++Eu9aq8CRgAjEOUIOBNHPrdOIfdLQEJSEACgxF4iNOj6/+OwS7z7KII+AhgHLI00t9z6PvjHHa3BCQgAQkMRuAAnf9gwIo+2x6ACQjTC7Awh2Okqh8LmoCThyQgAQlMQuAijsenfp+e5DwPl0jAHoAJYNNYo8tqB+TxCU7zkAQkIAEJjE8gPr2+r85/fEBVHTEAmIQ8jXY6p3xgktM8LAEJSEACvQl8vXMf7X3UvZUR8BFAn+h5HBDjAd7d5+meJgEJSEACc811MxBWJQB4VBj1I2AA0GedEAA8n1Pjs8Fr9HmJp0lAAhJImcAsjN8U5z81ZQh1tt1HAH3WDo04xgHEeAA/W9knM0+TgASSJvA1nX+9698egAHrh56Abbjkl4jB04DsPF0CEkiGQHxZ9fWdH07JGN00Q3ViA9YYDfpELvnwgJd5ugQkIIFUCDyJobvr/Otf3QYAQ9QRDftwLvv8EJd6iQQkIIG2EziEe6Rf+mtALfsIYIRK4nHAkVz+nhGy8FIJSEACbSJwIcasTwDwVJuMaqstBgAj1CwBwNxcfgIS4wJMEpCABFImEK/6vRbnf23KEJpku48ARqitTpS7M1mcN0I2XioBCUigDQQ+rvNvVjXaA5BDfdET8AKymYqslkN2ZiEBCUigaQTi42lbEADEu/+mhhAwAMipoggCFiOr3yJr5ZSl2UhAAhJoAoH7UfI1+H4/89uE2urS0UcAXTBGWaXx38f1myFnj5KP10pAAhJoGIEP6vwbVmMddQ0Acqw3/gn+QXZvRk7LMVuzkoAEJFBXAj/lvveTuiqnXhMT8BHAxHyGOsrjgHm58Fhku6Ey8CIJSEAC9SfwZ1RciwDg4fqrqoa9CNgD0IvKiPv4h3iCLHZCfjxiVl4uAQlIoI4E4pW/HXT+daya/nUyAOif1UBn8o8xkwvehfz3QBd6sgQkIIH6E3gf97ir6q+mGk5EwEcAE9HJ6RiPBHYlq5g1MD4pbJKABCTQZALfw/nv02QD1P0ZAgYAJbUEgoA1KepXyNIlFWkxEpCABPImcCkZrkcAEJ9HNzWcgAFAiRVIELAkxcWnhNcusViLkoAEJJAHgQfJJD7xe0MemZlH9QQcA1BiHfCP8zeK2wg5usRiLUoCEpBAHgT21PnngbE+eRgAlFwX/APNQPag2P2QGElrkoAEJFB3Aodx34pHmKYWEfARQIWVySOBV1J89Ab4SKDCerBoCUhgQgLxsbONCQDizSZTiwjYA1BhZfIPFZ/N3AD5LOI/V4V1YdESkEBPAvew9x06/55sGr/THoCaVGHnLYFjUGflmqikGhKQQNoEnsL8t+D840t/phYSsAegJpXKP9kfUeV1yP8gflKzJvWiGhJImMBHdf7trn17AGpYv/QGxCeFIxBwbEAN60eVJJAAgSNw/u9LwM6kTTQAqGn1EwRMQbU9kS8iL0FMEpCABMogcCaFbEEA4LikMmhXWIYBQIXw+ymaOGARzjsI+SDyXMQkAQlIoCgCMTB5HZz//UUVYL71IWAAUJ+6mFATAoFVOeEbyGYTnuhBCUhAAsMRCKe/Ns7/uuEu96qmEXAQYENqjH/Kq5DNUXdT5KyGqK2aEpBAMwg8iZrb6/ybUVl5aWkAkBfJkvLhH/QsJIKAmD/gtyUVazESkEC7CXwg7i3tNlHrxhIwABhLpCHb/LOeh7wFdeONgRMRXx1sSN2ppgRqRuBr3Eu+VzOdVKcEAo4BKAFyGUUwRmB1yvkPZCdkvjLKtAwJSKDxBE7Bgm0IAJ5uvCUaMDABA4CBkdX7gs5bA7uh5d5IBAUmCUhAAr0IXMnO9XD+/+h10H3tJ2AA0OI6JhiIxwMRCOyCLNhiUzVNAhIYjMBdnB4j/m8Z7DLPbhMBA4A21eY4thAIhPN/B7IDEgMI50VMEpBAmgQexOz4ut/0NM3X6oyAAUBGIpElwcBCmLoFsi2yJbIYYpKABNIg8Bhmxix/56RhrlZORMAAYCI6LT9GMBAzC8brhBEMbI2siJgkIIF2EoipfbfD+Z/cTvO0alACBgCDEmvx+QQEi2Peul2yJuu+UdDiOte0ZAjEa8J74Pzjk+MmCfyTgAGADWFcAgQE83Aw3iSIoGAdZGUkegkWRkwSkEBzCHwE5x9TiZskMJuAAcBsFK70S4DA4EWcG4HACmOWS7K9CBIBwtyISQISqJ7A53D+B1avhhrUjYABQN1qpCX6ECTEmwcRDGTyUta/isTSJAEJlEPg2zj//copylKaRsAAoGk11kB9CQbegNo/QaLHwCQBCZRD4GcU804CAGf5K4d340rxWwCNq7LmKIzjfw7yKTQ+D9H5N6fq1LT5BE7DhN11/s2vyCItsAegSLoJ543jXxrzj0E2SRiDpkugCgLTKHRznP+jVRRumc0hYA9Ac+qqMZri/LdD2csRnX9jak1FW0LgT9ixlc6/JbVZsBkGAAUDTil7HP98yHew+QTEGQZTqnxtrQOBC1FiM5z//XVQRh3qTyBmgjNJYGQCOP7VyeSnyCojZ2YGEpDAoATO5YItcf5+2W9Qcgmfbw9AwpWfh+k4/kgfJq/49aHzzwOqeUhgMAJTOf3NOv/BoHn2XHPZA2ArGJoAjv8lXPxD5C1DZ+KFEpDAKAR+z8Xb4vzjIz8mCQxEwB6AgXB5ckYA5/9m1mOgn84/g+JSAuUS+A3FbaPzLxd6m0ozAGhTbZZgC45/YeR/KOpUJD4eZJKABMoncCJFvg3n/3j5RVtiWwj4CKAtNVmCHTj+XSnmK8gSJRRnERKQQG8Cx7N7F5z/k70Pu1cC/REwAOiPU9Jn4fhfBYBvIRslDULjJVA9gWNRIWb4m1m9KmrQdAI+Amh6DRaoP45/QeRLFDEd0fkXyNqsJdAHgZhZczedfx+kPKUvAvYA9IUpvZNw/DtitV/vS6/qtbieBL6NWh/E+fthn3rWTyO1sgegkdVWnNI4/lciv6OEnyN+urc41OYsgX4JHIDj30/n3y8uz+uXgD0A/ZJq+Xk4/fkw8QDkP5F5W26u5kmgCQRikN97cfxHN0FZdWweAQOA5tVZ7hrj/Lch028gy+WeuRlKQALDEIgpfXfA+UdvnEkChRAwACgEazMyxfEvj6bfRLZuhsZqKYEkCNyJlTGv/6VJWKuRlREwAKgMfXUF4/hfROkfQ2IO/+dXp4klS0ACYwj8he2Y1//mMfvdlEDuBAwAckda3wxx/C9Gu3D8H0AWqK+maiaBJAmcj9Vvxfnfl6T1Gl06AQOA0pGXXyCOPz7aE4P73o/o+MuvAkuUwGQEfskJ78T5O7XvZKQ8nhsBA4DcUNYvIxx/zNWfOf7566ehGklAAhD4X+RDOH/f8bc5lErAAKBU3OUUhuOPufo/jrwPidf7TBKQQP0IzEKlT+P4v1g/1dQoBQIGAC2qZRz/kpjzCWQfRMfforrVlNYReBiL9sD5n9A6yzSoMQQMABpTVeMriuNfiqOZ43dU//ioPCKBOhC4DiXiU75X10EZdUiXgAFAg+sex7806n8SeS+i429wXap6MgROwdJdcf4PJmOxhtaWgAFAbaumt2I4/Skc2RyJbv5tkXkQkwQkUG8C8bz/c8hncf6xbpJA5QQMACqvgv4UwO/HwL69kPciL+/vKs+SgARqQCCm9d0dv//rGuiiChKYTcAAYDaK+q3g9ONrjW9C4td+zNdvfQHBJIEGEYiZ/eJ5/58bpLOqJkJAh1LDisbxx2j+dyPxa385xCQBCTSPwImoHL/8H2qe6mqcAgEDgJrUcufX/haoE7/24+M81k1N6kY1JDAggXjGfzByCM7f5/0DwvP08gjoZMpj3bMkHH+M5M9+7S/b8yR3SkACTSEQv/Z3w++f1BSF1TNdAgYAFdQ9Tn8xit0K2RHZEpkbMUlAAs0mcBHqxyt+1zfbDLVPhYABQEk1jdNfkaJiIF/IBohOHwgmCbSAQMzhH9P5fhbnP7MF9mhCIgQMAAqq6M4z/TeQfbyrH07/VQUVZbYSkEB1BG6j6OjyP7s6FSxZAsMRMAAYjlvPq3D6Mf/+5kg4/RjIF1/jM0lAAu0k8HPM2hfn/0A7zdOqthMwABixhnH6LyGLcPbh9OOdfT/CAwSTBFpMID7k80Ec/1EttlHTEiBgADBgJePwF+SStZB1kXD8ayMxYY9JAhJoP4ELMTEG+t3QflO1sO0EDAAmqGGcfQzUWxUJJ59JPMvX4QPBJIGECMRAv0ORg3H+DvRLqOLbbKoBQFft4vBfymY4+hi8F8s1kQUQkwQkkC6BWzE9Bvqdky4CLW8jgWQDgE5Xfjj47Jd9LJdqYyVrkwQkMDSBn3DlB3D+DvQbGqEX1pVAqwMAnPzzAf8yZPmOLNdZrsLSrnwgmCQggZ4E4vW+/XD8J/c86k4JtIDAFGxYHLmfhv5E0+zBwUcAswwy1sFn2/EJ3bDRJAEJSKAfAvGs/9vIp7gnxmd8TRJoLYFwoDEt7Y9wptEdfjdy1yTLezj+GPIE/yAjf+iCcmNA3fxIPGufTBblnO5f9PHMPgbqmSQgAQmMSuBqMtib29r5o2bk9RJoAoEpmQ/HEW+Pwl9FBvkgzQzOD3m8I9l6toz9sR5pPOfue/PP8PGvBCRQDYHo/fwCcij3w8b1hFaDzFLbQGB2ABDGEATEL/FPIf+JPA8xSUACEmgzgWkY914cf/z6N0kgKQLPCgAyywkEVmD960hMdGOSgAQk0DYC8Xz/08i3cP7x3N8kgeQI9AwAMgoEAlux/g0kAgKTBCQggTYQOAUj3o/jj5H+JgkkS2DCGe34B4l/lFWRzyCPJktJwyUggTYQuBMjduG+trXOvw3VqQ2jEpiwB6A7c3oDYnDgYcgO3ftdl4AEJFBzAjEYOe5dX8TxP1xzXVVPAhLawMAAAAkuSURBVKUR6DsAyDQiENic9W8iMZmOSQISkEBdCcRryscin8Txx3S+JglIoIvAhI8Aus6bvco/0ulsrI58DHGijNlkXJGABGpEIEb3r8f96p06/xrViqrUisDAPQDd2tMbsCTbX0J2697vugQkIIGKCNxCufGLP375myQggQkIjBQAZPkSCGzA+heR9bN9LiUgAQmUSCCe7cdkPl/F+cczf5MEJDAJgVwCgKwMAoE3sX4wsm62z6UEJCCBAgnEO/w/QA7E8ccof5MEJNAngVwDgKxMAoEtWI9AID6xa5KABCRQBIEzyXR/HP9lRWRunhJoO4GBBwH2A4R/yNOQdTg3JhK6uJ9rPEcCEpBAnwRigN+bucdspvPvk5inSaAHgUJ6AMaWQ49ATCl8EPL6scfcloAEJNAngfM472Cc/u/7PN/TJCCBCQiUEgBk5RMIbMP6Qchrs30uJSABCUxC4FyOh+OPV5BNEpBATgRKDQAynQkE3sb6QUjMJ2CSgAQk0IvA2ewMxx/P+k0SkEDOBCoJAMIGgoApLLZDDkJeg5gkIAEJBIGpSDj+WJokIIGCCFQWAGT2dAKB7dn+LPLqbL9LCUggOQJnYfFBOP745W+SgAQKJlB5AJDZ1wkEdmT7QMRAIAPjUgLtJxDP9g/B8Z/TflO1UAL1IVCbAKAbCcHAJmx/ANkWeW73MdclIIFWEIjZ+n6CfBPH73v8rahSjWgagVoGABlEAoGlWd8X2RtZItvvUgISaCyB29H8W8j3cPz3NtYKFZdACwjUOgDI+BIIzMP625HoFXhjtt+lBCTQGALxDn98RvwEHP/MxmitohJoMYFGBADd/AkG4o2BCAR2QxboPua6BCRQKwIz0Ca+yhfd/JfUSjOVkYAE5mpcAJDVGYHAIqzvgeyHrJTtdykBCVRO4K9o8B3kCBz/3ZVrowISkEBPAo0NALqtIRjYnO0IBGKmwbm7j7kuAQmURuACSopu/l/g+J8srVQLkoAEhiLQigAgs5xAYBnWs0GDL8n2u5SABAojEL/2f4wcjdO/srBSzFgCEsidQKsCgIwOgcC8rO+ARK/A+tl+lxKQQC4EHiWXXyFHIWfg+J/KJVczkYAESiXQygCgmyDBwPJs74S8A/EjRN1wXJdA/wRmceofkKOR6OL/R/+XeqYEJFBHAq0PALqhEwy8gu0sGPD7A91wXJdAbwJ/YfcxITj9W3uf4l4JSKCJBJIKALoriGBgFbazYCDWTRKQwDME7mMRr+/Fc/0LhSIBCbSTQLIBQHd1EgxEb0AWDEQvgUkCqRH4OwafgvwSORXH/0RqALRXAqkRMAAYU+MEAzFOIIKBkJePOeymBNpEILr3T+zINJy+g/naVLvaIoFJCBgATACIYGAtDmfBwLITnOohCTSBQDj4c5GTkBNx+Nc1QWl1lIAEiiFgANAHVwKBKZy2DhKfK34z4pgBIJgaQeAhtPwtEk4/uvbj+b5JAhKQQHOnAq6y7ogHlqT8TTuyGcuXVamPZUtgDIFb2I6u/XD6U3H6zso3BpCbEpDAXAYAeTQCAoIYKxCBQBYUvCSPfM1DAn0SuIPzpiLxnn44fLv2AWGSgAQmJuAjgIn5DHy087hgVS7MAoKNWI8PF5kkkBeB28hoKpI5/Bvyyth8JCCBdAgYABRc1wQEc1PE65EsIIipiecruFizbxeB6NKfimQO/6Z2mac1EpBAFQQMAEqmTkDwPIpcD4nHBREUxJsGz0VMEsgI3MhKOPvM4UcAYJKABCSQKwEDgFxxDp5ZJyB4NVeu3pE1WK6GLIqY2k0gBuddjUzvkst4hn9/u83WOglIoA4EDADqUAs9dCAwiDcLIhjoDgyWZ3tKj9PdVX8CD6LiZUg4+0s7y6tx9s64BwyTBCRQPgEDgPKZD10iQcFCXBy9A92BQUxj7JiCoakWcuGt5Nr9q346jt7n9oWgNlMJSGBYAgYAw5KryXUEBTHIML5fED0FWWAQjxSWQuKYKX8CM8gyHHo8qw+JUfjZ+o04+0fZNklAAhKoNQEDgFpXz/DKdQKDJcjhpcgynWWsd0sECfMgpjkJ3M2u2U6d9W4nfwdOftacl7hHAhKQQHMIGAA0p65y15Qg4TlkujjSHRSMDRiW5vi8uRdefoYzKTK+eHdvl9zTY/1O9sWv+IdZmiQgAQm0loABQGurNh/DCBJi0OGLkQgMFkNivEHI/F3r2b5Bltn1WQ9E/KKOAXEh0cWerU+23X1uDLQLB9/LsT/gr3bImCQgAQl0CBgA2BQqJdB5VPEcnHO8EmeSgAQkIIGSCBgAlATaYiQgAQlIQAJ1IhDPgE0SkIAEJCABCSRGwAAgsQrXXAlIQAISkEAQMACwHUhAAhKQgAQSJGAAkGCla7IEJCABCUjAAMA2IAEJSEACEkiQgAFAgpWuyRKQgAQkIAEDANuABCQgAQlIIEECBgAJVromS0ACEpCABAwAbAMSkIAEJCCBBAkYACRY6ZosAQlIQAISMACwDUhAAhKQgAQSJGAAkGCla7IEJCABCUjAAMA2IAEJSEACEkiQgAFAgpWuyRKQgAQkIAEDANuABCQgAQlIIEECBgAJVromS0ACEpCABAwAbAMSkIAEJCCBBAkYACRY6ZosAQlIQAISMACwDUhAAhKQgAQSJGAAkGCla7IEJCABCUjAAMA2IAEJSEACEkiQgAFAgpWuyRKQgAQkIAEDANuABCQgAQlIIEECBgAJVromS0ACEpCABAwAbAMSkIAEJCCBBAkYACRY6ZosAQlIQAISMACwDUhAAhKQgAQSJGAAkGCla7IEJCABCUjAAMA2IAEJSEACEkiQgAFAgpWuyRKQgAQkIAEDANuABCQgAQlIIEECBgAJVromS0ACEpCABAwAbAMSkIAEJCCBBAkYACRY6ZosAQlIQAISMACwDUhAAhKQgAQSJGAAkGCla7IEJCABCUjAAMA2IAEJSEACEkiQgAFAgpWuyRKQgAQkIAEDANuABCQgAQlIIEECBgAJVromS0ACEpCABAwAbAMSkIAEJCCBBAkYACRY6ZosAQlIQAISMACwDUhAAhKQgAQSJGAAkGCla7IEJCABCUjAAMA2IAEJSEACEkiQgAFAgpWuyRKQgAQkIIH/D3oDcFD+iW2WAAAAAElFTkSuQmCC'/%3E%3C/defs%3E%3C/svg%3E)

When Oji Paper implemented Braincube, they reduce paper production costs while still increasing its market share.
Even though Statistical Process Control has been leveraged for almost a century, self-service analytics tools are equipping manufacturers with new ways to drastically improve efficiencies.
Currently, many manufacturers spend just as much time—if not more time—fixing problems on the fly as they spend on continuous improvement. In today’s competitive industry, unplanned downtime is not an option, which is why more and more companies are relying on automated SPC methods to improve their efficiencies.
Improving compliance with standards and regulations makes it possible to reduce variability and costs while improving productivity. Automated SPC, control charts, and other self-service analytics tools are readily available today and facilitate a more diverse user group to benefit from SPC techniques.
These tools help the shop floor comply with standards, avoid costly downtimes, and process variability, and improve performance by quickly reacting to any drift, even if SPC is currently part of your data culture.
Depending on the industry you work in, and competing priorities, how you use SPC has a different purpose. Let’s examine three use cases for improved operational performance.
While variability in any process is evitable, implementing new process control methods where they do not exist today can yield instantaneous value. If you take a DMAIC approach as an example, you must first define, then measure, and analyze to reach optimal performance.
What does that have to do with SPC?
In traditional manufacturing analyses, you typically compare a single number to a reference number. This could include comparison data such as production this week vs. last week’s second quarter sales year over year, or the cost vs the plan. For many quick studies, this is highly effective.
Based on your comparison, you then build an action plan, you see instant resolution, and you’re on to your next challenge. However, for larger scopes, this type of comparison can steer you in the wrong direction.
When comparing data with an apples to apples mentality, you may take special action on something that’s actually a common cause. For example, say a large company has several instances of minor errors reported in their complicated expense reporting system. Instead of examining errors over time, you make a decision to take disciplinary action on the next person who makes an error on their expense report.
While this may have a short-term effect on performance, it may be missing key trends occurring over time. Further, this method often fails to account for the impact of time on your dataset. You must determine your baseline over time to truly understand the volume and gravity of your standard and the special causes of deviation.
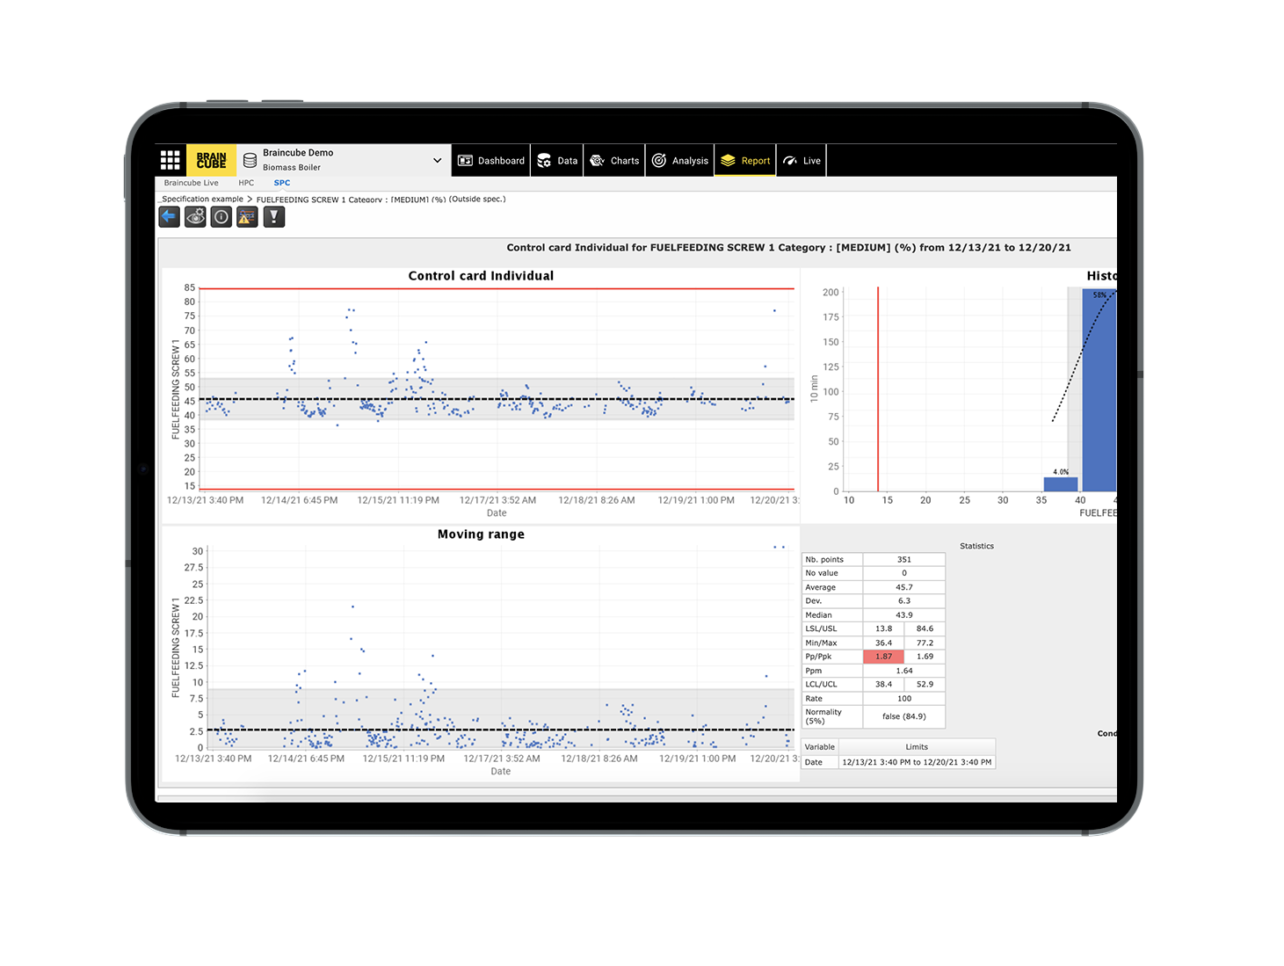
To gain a more detailed understanding of the behavior of a process, process location, and process dispersion, many manufacturers rely on control charts to understand the ‘voice of the process.’
Control Charts are an SPC method designed to analyze process performance. Automated Control Charts, like those from Braincube plot data points, control limits, and your centerline. In turn, they can be used to classify variation as controlled (common to the process) and uncontrolled (due to special circumstances) variation. They help you to answer:
However, historically, Control Charts are time-consuming to build and maintain. While many engineers especially see the value, they are too busy solving other priority ticket items to keep their control charts alive and well.
With the influx of low-code/no-code solutions, it becomes simpler to execute Control Charts with little to no additional manual maintenance to complete or maintain.
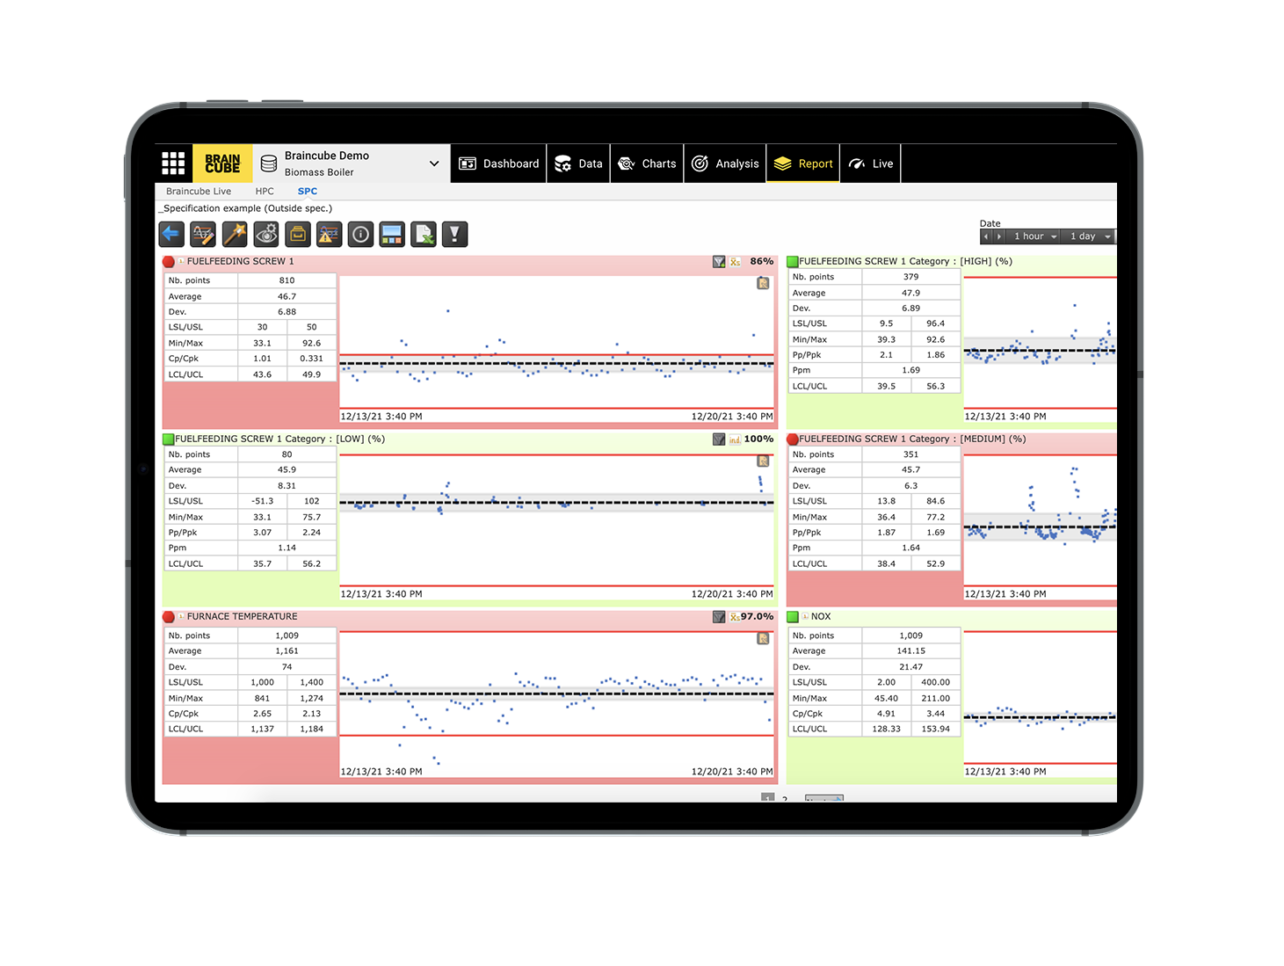
The Braincube Control Charts App centralizes your production conditions monitoring into a platform that is readily updated and available to monitor SPC statistics in real-time. Whether you’re looking to follow min, max, cp, cpk, variance, normality, or other data point, this app can single-handedly help you to reduce variability, increase productivity, and reduce production costs.
For those getting started with more automated condition monitoring or looking for more tools to help with process stability, this is a good place to start.
We saw substantial improvement when a major paper manufacturer wanted to reduce the chemical consumption in their paper machine. First, they benchmarked their settings then they leverage SPC to better stabilize their process. This Braincube customer leveraged Braincube apps to create Statistical Process Control groups with 28 consumption variables and, for each one, the operational ranges of each product reference. Leveraging process and quality control apps helped them not only monitor progress but to more frequently stay within limits.
During this process stabilization phase, focus efforts on implementing new process control methods where they do not exist today.
The Braincube SPC Report app equips everyone at each level of the organization with the chance to benefit from a powerful digital tool. These data-driven insights have resulted in better process stability, reduced production costs, and improved customer satisfaction.
Once you’ve established methods and processes for monitoring SPC, to expand upon your value, you may want to consider ways to leverage additional automation for continuous improvement. Historically teams were often left to verbal or written updates about how a shift performed.
Now, with data story dashboards, like those from Braincube, teams now have an automated way to understand and report on what happened before (and during!) morning meetings and on-demand as needed. This can be your launch pad for understanding performance but can further lead you into root cause analysis through a single platform that brings together different sources of data, including SPC.
It’s worth noting that the value of an IIoT Platform isn’t limited to the functionality of a single, but really it’s taking a holistic strategy toward your digital transformation.
Yet there is innate value in time savings and reducing reaction time. With the SPC Report App, you’re able to automate the frequency, display, and sharing of these reports at a cadence that works for your business goals.
These tools automate your SPC tracking and alert you when you’ve drifted out of control limits. This not only saves you precious time and reduces your scrap, but it further allows you to maximize your production processes to achieve consistent quality and performance.
Whether you want to extend the life of legacy assets, improve your production costs, or integrate a new piece of equipment onto your line, early alerting and advanced process control are worth considering.
For example, every so often, part of your line stops. If you don’t get it up and running quickly, then your backlogs and bottlenecks will drive you to a full shutdown. SPC, Control Charts, and alerts could be used in tandem to ensure that parametric measurements are performing in a normal distribution. If measurements do not follow that normal distribution, it can be indicative of an upcoming problem with materials, personnel, design, or the machinery used in manufacturing or testing.
Automated alerting helps to reduce scrap, defects, and rework, saving you substantial money in throughput and production costs. It can also help you to maintain compliance with regulatory and customer requirements. And being able to demonstrate that you are compliant internally, or for a client is simpler when it’s all built into a single consolidated report.
Beyond alerting, automated Statistical Process Control (SPC) can bring even more automation and intelligence to your processes. Tools like IIoT allow you to quickly share and implement findings to other lines or sites as relevant.
As your maturity with automated SPC continues to grow, you’ll start to not only be able to react as soon as a drift appears and avoid costly issues, but you’ll further be able to diagnose why something happened and prevent it from recurring.
By collecting and analyzing your performance over time, you have more accurate traceability and understanding of the intricate details of a product’s production process. This is made simpler with the SPC Report App and Braincube’s CrossRank AI. In turn, you benefit from stronger production stability.
For example, a Braincube customer wanted to improve their compliance reporting. They were looking to also improve their reliability, accuracy, and traceability during critical steps of the production cycle.
Instead of manually pulling together the performance report each time it was needed, they relied on Braincube apps to continuously provide these updates. Since bringing in Braincube, they’ve saved hours of time, and thousands in scrap, and are still meeting customer demands for compliance reporting. This data-driven usage is a win across the organization, including the shop floor.
In fact, the SPC Report App and the alerts function helped this customer pass their ISO9001 audit. The Braincube SPC Report app equips everyone at each level of the organization with the chance to benefit from a powerful digital tool. These data-driven insights have resulted in better process stability, reduced production costs, and improved customer satisfaction.
If you want to take it a step further, you can even consider Digital Twins, which helps you to further understand how to capitalize on your best performance, reach specific KPIs, or in general continuous improvement efforts.
Digital Twins from Braincube follow the flow of materials, helping you to understand what happened during production. By uncovering how a product was made, you can not only view statistical data, but also you can understand the right recipe for moving forward. Digital Twins encapsulate the exact conditions used for each product, batch, or serial number produced.
Once this information is continuously structured, teams can rely on better visualization, improved compliance, and even customer satisfaction with SPC reports. Oftentimes clients want to see a comprehensive view of process/quality data, which can be built into a workspace that is continuously leveraging the most recent data.
While SPC has long been a strategy for many organizations, tools that automate and bring new intelligence to the information collected are inviting manufacturers to a new opportunity to improve their workflows.
Even if you already have a tool for SPC, tools like an IIoT Platform and digital twins can bring more efficiencies by continuously collecting and organizing your data around business value.
By using a product that helps to automate much of the manual, tedious data processing, teams benefit from cost savings, greater productivity, and fewer line stops. As Industry 4.0 continues to create a pressure field for those in industry, digital tools like those from Braincube are offering solutions that help you accelerate your digital transformation.

This white paper breaks down five successful maintenance strategy stages from reactive to predictive. Learn how to advance your current maintenance strategy, including key technologies that can help make your vision a reality.

Our platform is enhanced with an advanced business intelligence app suite dedicated to manufacturers leveraging the flexible infrastructure to collect, integrate, and structure your real-time and historical data from IT and OT systems

Learn how Kimberly-Clark, a leading paper manufacturer that produces consumer paper and personal care products, was able to implement closed-loop production processes by leveraging Braincube’s IIoT Platform and ready-to-use apps.
Revolutionize your paper manufacturing with AI-driven optimization. Enhance efficiency, cut costs, and achieve autonomous operations like industry leaders Arjowiggins and Oji Paper. Embrace the future of smarter production!
Learn more

Integrating prescriptive and predictive analytics into daily workflows allows operations teams to make data-backed decisions, continuously improve processes, and drive key performance indicators with greater accuracy.
Learn more