Revolutionize your paper manufacturing with AI-driven optimization. Enhance efficiency, cut costs, and achieve autonomous operations like industry leaders Arjowiggins and Oji Paper. Embrace the future of smarter production!
Learn more
Looking for advanced food use cases? Read about autonomous technologies.
Food manufacturers are gearing up to meet high projected growth demands. The food manufacturing industry is predicted to have a volume growth of 4.3% in 2024. To meet these rising demands, food producers are revisiting ways to improve volume and are looking at how better quality can drive higher yields and profits.
While quality control in food manufacturing is a constant north star, regardless of supply and demand, manufacturing as an industry is grounded on continuous improvement. Even though key performance indicators don’t often change, the available tools and technology are ever-evolving. If companies pursue the right use cases, they can bring drastic improvements to their organizations.
Remaining competitive in one of the largest industries in the world is especially critical when there is rising demand, tight margins, and pressure to produce sustainably. While there are many strategies to improve quality, this article will dissect specific examples that can help drive profitable production across your product lines.
Here are some of the key “less than obvious” opportunities that food manufacturers can use for quality control.
Growing staffing challenges—including many process experts reaching retirement age—make it critical to revisit operational excellence in a new, data-driven world.
Surprisingly, this move to be data-driven does not mean you need to digitize your operations in a single swoop. Instead, we find that most of our customers identify an asset, specific product, or common source of waste in their process to validate results before layering on additional use cases.
By beginning with a single KPI (e.g., reducing waste by 3%, increasing yield by 5%, or reducing the total cost to produce by 7%), teams remain focused on a clearly defined goal. Once you get your first KPI off the ground, you can continue building upon this pillar use case. This can reinvigorate teams to improve processes and move toward operational excellence.
Our first use case focuses on throughput, with a company that needed to improve its production volume to meet rising customer demands.
In food manufacturing, regardless of a KPI on yield, waste, or OEE, these use cases typically trickle up into general quality control requirements.
Quality control is addressable in many ways. However, something we often hear is that quality data isn’t reaching teams quickly enough. There is a delay between when quality data is captured and when teams can see production data. It may be minutes, hours, or oftentimes, a day or more before teams understand what was produced.
As you can imagine, reviewing quality data 24 hours after production leaves teams with little opportunity to resolve problems quickly. A lack of performance visibility not only increases avoidable waste (due to slower reaction times) but also demotivates employees who feel that they don’t have the information needed to be successful. Even though many food manufacturers leverage experts to drive decisions with intrinsic knowledge, it’s not always a guarantee that he or she will be available or that he or she is actually making the best decisions.
Many of our food manufacturing customers want visual KPI tracking that can be customized and accessible from anywhere. This can create a bottleneck for IT as they are tasked with compiling several different reports for different teams in different formats.
For example, a corporate team may need a dashboard to view energy consumption across the plant, which requires data from three to four different systems. An engineer may need production and quality data for root cause analysis. At the same time, the shop floor needs to understand what is happening and what to do about changing conditions.
Like many manufacturers, a lack of data visibility and data democratization is impacting profitability. Limited real-time data hampers teams’ abilities to address quality concerns before they generate waste or downtime.
Quality control has always been a critical part of the food industry due to many strict federal and local regulatory requirements. As such, most organizations have already deployed Six Sigma and lean manufacturing strategies. This means there are few low-cost, high-value optimizations left on the table.
The good news is that there are cost-effective solutions to break the data barrier and bring different teams information in the right format and at the right intervals.
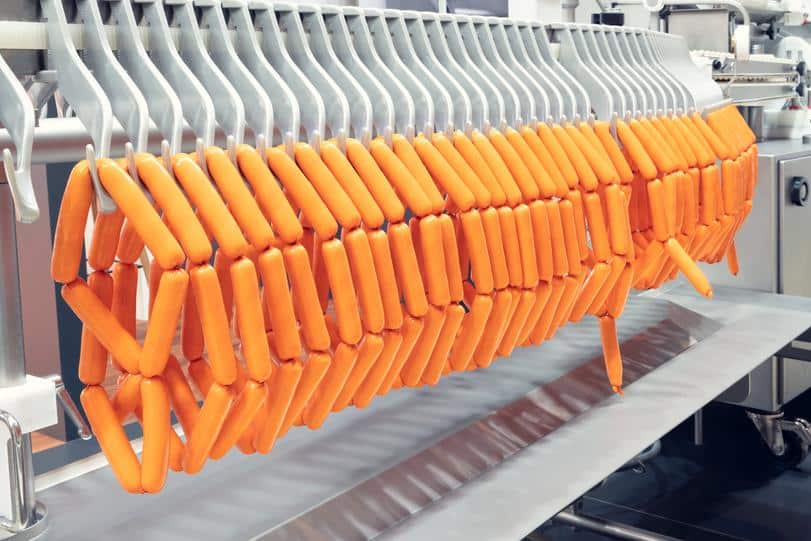
Recently, a meat manufacturer came to us needing to increase throughput. Prior to Braincube, they had limited visibility of real-time performance, leading to frustration and inconsistent products.
This data delay had numerous negative business effects: irregular throughput, high waste volumes, and defeated teams. This production manager knew he could improve his team’s working conditions and his company goals with the right approach.
Knowing how committed his teams were to quality improvement, he decided to leverage his data in a gamified approach to drive better performance. This company believed that if their production teams could clearly view real-time performance, they could drive an uptick in throughput.
They also knew that digitizing parts of production may be met with some resistance. This is why gamification was a critical part of their approach. Implementing gamification meant utilizing engaging data displays and ensuring the right cultural shift.
Once implemented, teams could leverage their data for faster reaction times, compete against the last run/shift, and prioritize their workload without waiting for another department to pull together a report. This approach would help teams improve communication by utilizing data instead of delayed reporting and word-of-mouth communication.

To start, they installed large monitors on the production floor. They used these monitors to display a quality control dashboard, which included the current production specs and the live operating range. This visibility enabled teams to communicate more effectively and move away from delayed reporting and reactive word of mouth.
Their goal was to “produce better today than yesterday.” This approach embraced healthy competition between shifts, runs, and for each team’s performance—all while incrementally raising their overall results.
The company improved yield by 50% by utilizing the gamification of live data! Building out this visualization solution only took a few days, as they had to connect and treat data from different systems into a single viewpoint used on the production line. Teams were thrilled to see this almost instantaneous improvement. Now, they’re considering what to tackle next.
When teams work together toward a common goal, they are often more motivated and collaborative. Building in a gamification element adds a nice, balanced competitiveness to reaching shared goals.
Post-pandemic, many manufacturers are trying to establish new ways of working. How has production shifted to accommodate a global pandemic? What should we keep doing and what should we forget?
A continuous theme we hear about is the value of remote monitoring. While the pandemic forced some industrials into digitization, it has also helped many manufacturers facilitate new high-value use cases across their organizations.
For example, greater data visibility means management can gain deeper insights while sitting at headquarters (or anywhere outside of the production environment) than ever before. Being able to view the performance of every line, plant, and product status offers information like never before.

Now, though, some manufacturers are hitting data fatigue and overload. With data siloed in different systems and formats, they struggle to focus and determine how to get their data consolidated in a reasonable timeframe. Despite this data fatigue, management is still under pressure to improve numbers. They’re told they need to leverage data to find cost reductions.
As mentioned earlier, sometimes quality and production data aren’t even visible until after production. This dampens the opportunity for cost reductions as the time to take correct action has passed. This means teams have either wasted products or products with less-than-ideal quality.
Ultimately, food waste is the result of not having clear visibility into what product to use first, how machines are performing, and other critical production information. Simply reducing data latency can have a major impact on drastically improving foot quality.
Obviously, if this were simple or inexpensive, it would already be solved for most manufacturers. Even though Industry 4.0 is “here,” the practical, day-to-day use cases are still being sorted out. Teams don’t have time to consolidate data or cobble together answers on demand. Fortunately, there are solutions that can consolidate your data sources into the views you want and at the frequencies that make sense for your product. Best of all, these solutions can be highly affordable, especially in relation to the cost-saving value they bring.
Recently, a yogurt manufacturer needed to view data from multiple systems in a single view that allowed for drill-down as needed. Together, Braincube and this food manufacturing customer identified what critical parameters different teams needed access to at all times. Then, they crafted a digital quality control workspace for each department, enabling everyone to have 24/7 remote monitoring. Triggered alerts and daily reports play a critical role in their strategy, too.
Management needed an accurate way to report on what was occurring at the factory’s micro or macro levels. At the same time, operations teams needed to know when and where there was a drift (in addition to their standard performance data). This food company leveraged Braincube’s visual data editor to configure its ideal data treatment.
For example, they triggered an alert for operations any time an asset underperformed. This alert would then be categorized in a summary dashboard where management can see any alerts as well as general performance data. By automating data treatment, teams across the company made drastic improvements to their quality goals. Their success further validates that augmenting data consolidation is a huge benefit for food manufacturers and their employees.
A holistic lens into production is critical for identifying cost reduction opportunities. In food manufacturing, each step plays a pivotal role in a food product’s final quality. The faster teams are alerted to a problem at hand, the less product they scrap.
For example, one of our dairy customers digitized how ingredients were labeled. This way, teams could always know which product to pull first. This one simple change reduced the amount of spoiled food the company generated, saving this company about $400,000 per week. The teams were overjoyed and used this momentum to identify additional use cases that could support the company’s waste reduction goals.
Whether teams need to report on waste volume, carbon impact, percentage of target, or other KPIs, having dashboards (aka workspaces) that continuously update and display changing conditions is a game-changer for most manufacturers. According to one customer, one of their shared workspaces (which displays and synthesizes different sources of information) saves managers 2-3 hours per day!
Spending time cobbling together data pulls your employees away from utilizing their craft skillset. Even with data visualization tools, Smart MES systems, countless sensors, and probably more data than you know what to do with, many companies struggle to extract meaningful value from their data.
By automating the continuous collection and treatment of data, management and production teams alike can improve efficiency by using technology to drive continuous improvement efforts. In addition, data consolidation can free up data or IT teams from processing tickets each time someone needs another report or format of data.
Whether you are a known brand or a small but mighty one, remaining competitive is no easy feat. Keeping your buyers satisfied means meeting stringent quality checks, but it also means production planning. Nowadays, customers demand visibility into their order’s status. They want to know exactly when something will arrive and how long they have to get it on the shelves or in the hands of consumers.
With food being such a saturated market, customer retention is a critical input for manufacturers. Clearer predictability and communication with buyers on product delivery offers better communication and meet expectations. Ultimately, these insights help improve your thin margins, by providing data that can help you to exceed customer expectations.
Nowadays, it’s not enough to give an average. Telling a buyer that, on average, your product arrives on the 13th of every month isn’t as helpful as it once was. Knowing if a product arrives sometime between the 5th and the 21st can’t help customers plan effectively. It means that your customer is either stuck waiting for a product to arrive or rushing to get it turned around as quickly as possible to ensure it doesn’t sit around as expensive inventory.
Better visibility for your buyers to see product statuses can be an advantage for highly competitive food producers. While many large manufacturers can afford an ERP system, there are alternatives that do not require as much budget or training resources.
Tools like Braincube can help you to better understand (and share) production statuses with your customers without overhauling your entire architecture. This opens up new opportunities to manufacturers who want to communicate when their product will arrive to their customers, without a long implementation plan. (Of course, if you already have tracking systems like an MES or ERP, we can also integrate our solutions within your architecture.)
Oftentimes, bringing this ideal report to life is a matter of configuring the data you already have into the necessary format. Even if your teams know how to do this, they likely lack the time—or even the correct systems—to do this.
There are straightforward data treatments, like formatting dates from day month to month day. But there are countless other data customization options that can create the holistic view that you need: all in a highly automated way.
Most IT systems can already connect with each other well. It’s more about setting up proper data flows to collect, structure, and forward that data to the right place, person, or system. Layering in dynamic calculations and data treatment can help teams better understand and monitor key KPIs.
For example, one of our customers was struggling to clearly predict when customer orders would be ready. They were stuck predicting “on average” and “it should arrive by.” This was frustrating for buyers who were reselling these products to upset customers. It also caused a scramble when the product was ready so that they didn’t miss any quality concerns before shipping.
Even with an ERP system and sales tracking, this information could only be consolidated by manual data entry. Even then, data was siloed to each individual plant. This prevented critical information from getting to the necessary teams, such as the customer service department.
Furthermore, each plant developed its own ways of working. As a result, management was frustrated with a lack of standardization for how customer orders were tracked and communicated.
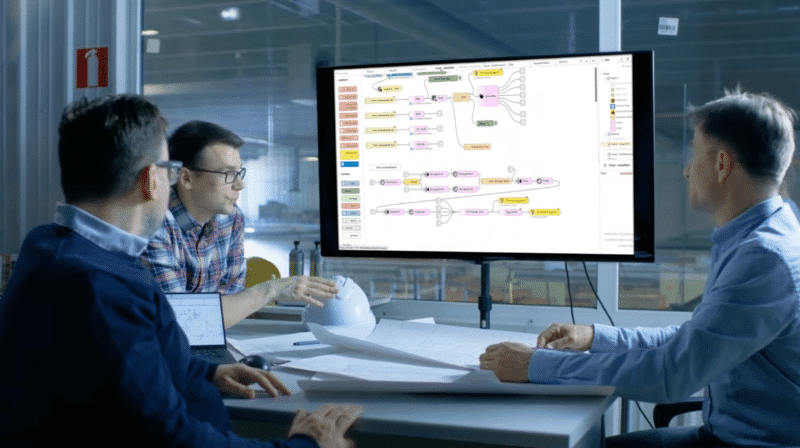
To create an ideal dashboard view, Braincube teams worked with corporate as well as process SMEs to agree on the right data for optimal business value. This resulted in an automated workflow that continuously collects and consolidates the ERP and sales data into an easy-to-digest dashboard. With this digitized information, teams were not only able to communicate more efficiently with buyers, but they were also saving ample time by automating the contextualization of data.
Now, customer service and production alike are able to expect and rely on the incoming pipe of information. Automating their customer order tracking data has enabled them to identify standard processing procedures company-wide instead of plant-by-plant. The company also configured an alerting system for when something starts going wrong, saving a substantial amount of money from faster reaction times.
Regardless of your digital maturity, additions to your tech stack can be centered around your highest-value use case. Maybe you can’t articulate what this is today and that’s ok.
Ask yourself what you want to achieve and let yourself ideate. Is it to improve yield, reduce bottlenecks, or to drive company-wide operational excellence? Regardless of your use case, tools like Braincube can help you to quickly deploy solutions and achieve results. Our food customers typically bring in ROI within the first two months of using Braincube.
Over the next few years, food manufacturing will continue to grow in volume. Some reports indicate that this growth may mean larger volume for larger companies and the consolidation (or even closing) of smaller factories.
While there are many opportunities for you to remain competitive in your market, remember that you don’t have to reinvent the wheel or build from scratch. There are tools and vendors that can guide your efforts, helping to make you scalable and sustainable in the long run.
Brand and customer loyalty are also projected to increase in importance. Thinking proactively about how you can do better today, tomorrow, and in the future is a must. It’s not easy to take the time to process and plan strategically. However, given the potential savings you may uncover, it’s worth it.
Reduced scrap, increased yield, and cost-saving measures across multiple production lines. See why the leading food and beverage manufacturers choose Braincube.
Improve Overall Equipment Effectiveness (OEE) with automated real-time calculations for any (or all) of your assets with Braincube’s OEE App

Since implementing Braincube, ofi improved its yield by 6.5% and achieved a 100% quality score on a key product line by implementing new AI-recommended rules.

Get a custom demo of Braincube and learn how IIoT can help your food manufacturing company reach its goals.