VISUALIZE DATA

Low-code/no-code dashboarding for all
skill levels with the Studio App

Combine data from all systems to create custom, interactive data visualization dashboards.

Braincube’s Studio App offers a comprehensive 4.0 portal for industrial data analysis and visualization, acting as a launchpad to view and act upon all of your IIoT use cases. The low-code/no-code environment combines the power of Edge and Cloud analytics in a single customizable workspace, remotely accessible. Centralize each of your IIoT projects—ranging from data visualization to analytics to reporting—and bring data intelligence in real-time to everyone in your organization.


FEATURES

  • Easily combine and access Edge and Cloud data from one centralized portal
  • Create custom, interactive dashboards in a no-code playground, or pull from a full catalog of off-the-shelf widgets
  • Build custom widgets and web applications with our easy-to-use WYSIWYG builder
  • Bring together any API or internet-based assets into your dashboards
  • Quickly duplicate, import, and export dashboards for cross-team sharing
STUDIO APP

Centralize, share, and scale data autonomy with Studio

  • A hybrid application for Edge and Cloud Analytics

    A hybrid application for Edge and Cloud Analytics

    Studio is a unique hybrid portal that can bring together real-time and historical data use cases into one workspace. For example, anyone can compare historical data to live conditions side-by-side, ensuring that production is running according to plan. Endless flexibility means you can build a single portal centralizing any 4.0 use case, regardless of the number of tools used at your organization. Studio makes critical information available to all teams, enabling everyone to access the same information.
  • Endless customization for users of all skill levels

    Endless customization for users of all skill levels

    An intuitive low-code/no-code workspace enables employees of all skill levels to build Studio dashboards that fit any goal, objective, or need—without requiring coding or developer expertise. Users can pull from our catalog of manufacturing-specific, off-the-shelf widgets to build interactive dashboards. The app also offers a coding environment dedicated to advanced users who can code their own widgets and apps for use within Studio.
  • Collaborate to scale success

    Collaborate to scale success

    Import, export, and share dashboards with the click of a button in order to scale best practices and upgraded standards Displaying the same information in different places—on the shop floor, in manager meetings, or at corporate headquarters—enables data transparency and scalability. One team’s wins can become the new standard for global facilities.

Data integration across the organization

Transformative data visualization for the entire company
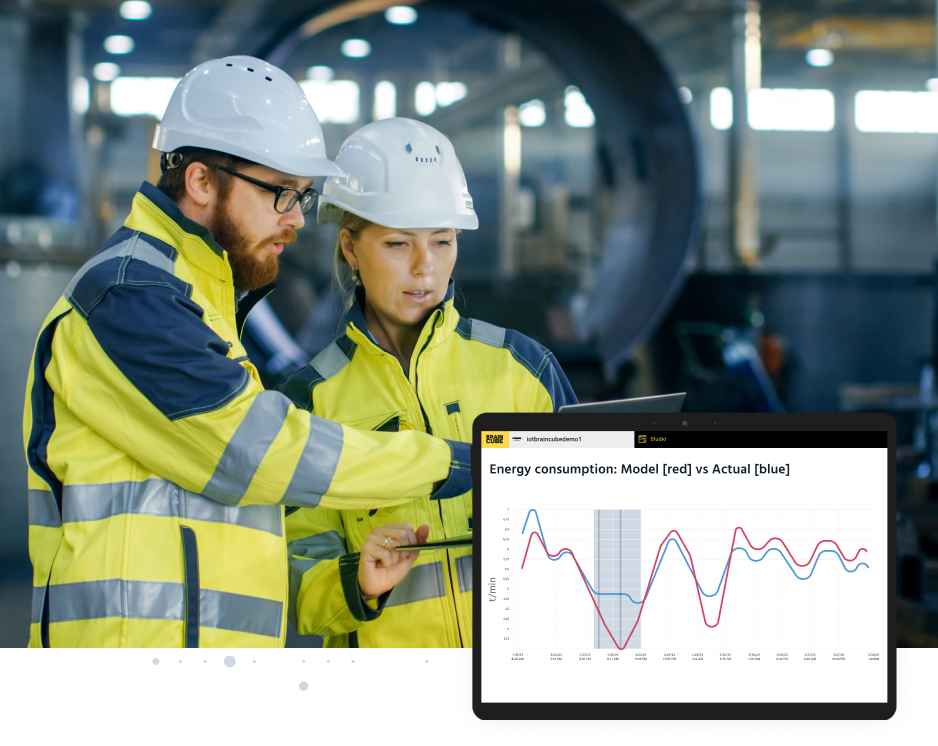
Data analysis and visualization with Studio

A Braincube building materials customer was advanced in their digital transformation journey toward Industry 4.0 at the corporate level. However, many of their IIoT use cases were focused on specific factories or teams.

Instead of purchasing yet another technology for their stack, they decided to leverage Braincube’s Studio App to simultaneously view, analyze, and implement discoveries across the organization.

Studio serves as their Industry 4.0 portal, centralizing their manufacturing data into useable information that is hyper-personalized by each end user’s needs.

What sets Braincube apart is that it brings together a lot of these different tools that we use to import data, push data, manipulate data, and analyze data.

Tyler Shirley, Asset Development, Electrical Engineer at Kimberly-Clark