ENTERPRISE VISIBILITY

Production visualization

Upgrade your data experience with visual displays of the most important historical and live information.

Production dashboards for better process control and optimization

Turn data into use cases on-demand

Using our agile framework, build use cases that display, describe, and improve production. Create user-specific dashboards that give individuals the exact information they need to succeed—without lag or clutter.

Upgrade your data experience

Consolidate real-time and historical data from any IT/OT source within a single interface. Data is automatically updated and formatted into the information that you need.

Engineered for action

Technical teams can pinpoint relationships that uncover multifaceted optimizations by leveraging a more comprehensive view of production data.

Braincube is the platform for data-driven manufacturing leaders

Braincube helps drive increased process efficiency with tools that help you visualize, stabilize, and optimize complex manufacturing environments.

Production visualization applications

Studio

Track and analyze business and production goals in a highly visual workspace that can be personalized to everyone’s individual data needs.

Dashboards

View Braincube charts, tables, reports, and more to quickly access, analyze, and report on performance. Create individual or shared dashboards that automate the data treatment needed to track progress via Braincube charts, tables, and reports.

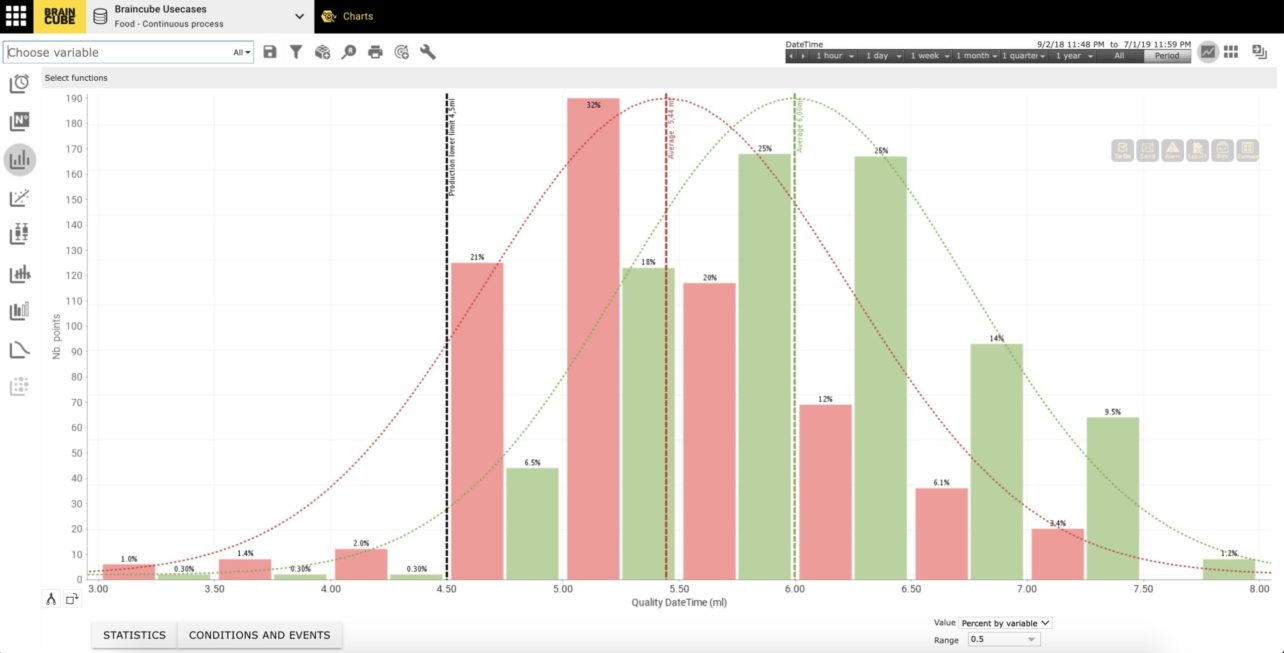
Charts

Drive cost-saving optimizations through a powerful descriptive analytics tool. Data is continuously updated, allowing technical experts to problem-solve on demand.

See what Braincube can do for you

Turn data into actionable insights that transform operations.
“Braincube’s visualization tools give us enhanced clarity on the data. We can get detailed ranges that help us better understand specific problems.”

— GK Lee

Process and Data Analytics Manager at ofi