What’s better than time series data for manufacturing process engineers?
Repeatable success, time and time again.
For more than 15 years, Braincube Digital Twins have helped leading manufacturers continuously achieve their goals—regardless of industry or use case. Read about their successes in our expansive case study library.
Many manufacturers assume that data analysis challenges stem from large data volumes. Given the amount of data necessary to follow a complex manufacturing process, this is a reasonable assumption.
The reality is that data complexity is the largest challenge that manufacturers face when it comes to data analysis. Today’s manufacturing datasets include more variables than humans (and even most technologies) can process. This makes it difficult to consistently stabilize—or even better, optimize—processes at scale.
Engineering teams often bring process optimizations from their intrinsic knowledge about physical processes, the assistance of tools like Excel, PowerBI, or data from other IT/OT systems. However, this approach is no longer enough for manufacturers to drive sustainable impact on profits.
Fortunately, some solutions automate data contextualization to diagnose and prescribe better alternatives. This automation will be the future of operational success. See why.
Can time series data be used to determine root causes?
For years, engineers have successfully used historical data to support production trend analyses, quota forecasting, and anomaly detection. Industrial engineers create time series data to capture a sequence of equally-spaced data points that are collected or recorded over time.
Time series data can then be used for a variety of tasks, ranging from predictions to determining plausible root causes. This data can also be used for identifying deviations from historical patterns or triggering specific actions, such as automated alerts when performance drifts arise. Using time series analysis, you can improve product quality, design more sustainable operations, and, ultimately, identify cost-saving opportunities.
While time series data can’t ensure that you will find root causes, time series analysis can identify probable causes. Time series data captures a linear view of time-stamped production data. As a result, time series data usually lacks critical information necessary for determining true root causes. For example, dynamic time delays between variables, also known as lag, are missing from typical time series data.
Time series data is best for informing predictions and detecting anomalies. On its own, time-series data is not designed to comprehensively connect how different inputs impact downstream outputs.
Even if lag is considered in a time series model, this approach has limitations. Building, experimenting, and maintaining time series models is both costly and demanding. Companies with limited resources may lack the budget required for hiring a data scientist team to build and maintain time series data models and cannot afford to go offline. Furthermore, to build a usable time series model, you typically rely on a large volume of historical data (which is not always available at every manufacturing company).
Determining root cause from time series data requires a combination of analytical skills, domain knowledge, and sometimes collaboration with experts in the field. For example, you may run a study on a machine failure, a series of defects, or a lowered productivity score. You use statistical methods to identify relationships between the time series data and a potential root cause. If you find something promising, you can put it into production and track changes over time.
But even in this example, you are forced to react to what has already happened, building additional impact to any loss you’ve already experienced. With predictions from time series analysis, you must wait until they happen before you can compare model predictions with actual results and see if your predictions are correct.
Time series data provides valuable insights to many different industries and can help engineering teams make major strides toward their production goals. In fact, Braincube offers time-series digital twins that can drastically improve operations’ bottom line.
However, on its own, time series data is not designed to comprehensively connect how different inputs impact downstream outputs. Instead, time series data is best for informing predictions and detecting anomalies.
Understanding how each variable is interrelated—both inputs and downstream—is critical for the production improvements that truly move the needle. This is especially true in continuous and continuous batch manufacturing where processes are disconnected.
What is the difference between time series data and contextualized data?
Time series data lacks contextual information that is generated during production. In order to get a full picture of your production process, you need your data set to be as accurate as possible to true production conditions. In other words: you need a contextualized data set.
One way to contextualize a time series data set is by accounting for residency time. Adding residency time to a data set means incorporating the different lengths of time that material spends in a particular state or phase when performing an analysis. This can be relevant for tracking and optimizing data workflows because it adds precision to your analyses, making it possible to pinpoint solutions rather than getting estimates or averages.
Take, for instance, process optimizations. Optimizations are the most efficient when data is closely associated with the physical reality of the process. Accounting for residency is a more accurate way to view and understand the production environment than just using time series data alone. This is because residency time is a critical way to ensure your data closely relates to the actual production environment.
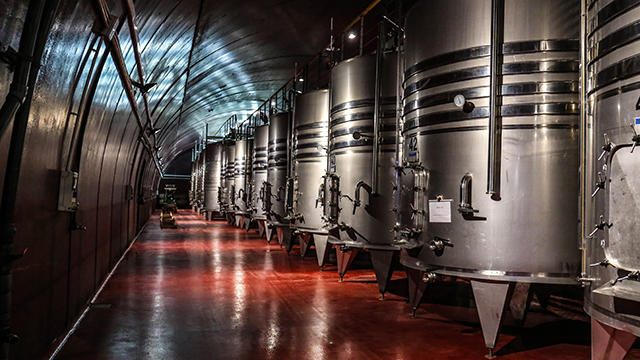
For example, let’s say materials move through a 10,000-gallon tank during production. Accounting for residency time means you recognize that fluid entering at the top of the tank will take 30 minutes to flow to the bottom when performing an analysis. You need to recognize that, when fluid hits the tank, it doesn’t immediately flow out of the tank.
If you perform an analysis without accounting for contextual information, such as residency time, you will have an inaccurate analysis that will likely lead to subpar results. Understanding—and accounting for—how long material remains in different states can help generate more accurate analyses, making it possible to identify bottlenecks and improve overall efficiency.
Residency time allows engineers to make more precise analyses than time series data alone. In turn, these analyses enable teams to change specific inputs that impact downstream outputs. Braincube leverages mathematical probability instead of predictions. To illustrate, residency time allows engineers to adjust and control the optimal flow rate, temperature, and other factors to achieve desired outcomes in manufacturing processes.
In simple terms, time series data helps engineers find patterns and make predictions. By adding contextual information like residency time (often by using digital twins), engineers can prescribe specific actions or solutions to improve processes or address inefficiencies.
Conclusion
Time series data and predictive analytics do not inherently suggest actionable steps to address or optimize identified scenarios. The reason this type of data can’t be used to generate prescriptive insights is that it primarily deals with patterns, correlations, and predictions instead of prescribing specific actions or solutions to improve processes or address inefficiencies. Most time series data sets also do not typically include contextual information, like residency time. Context is critical when trying to understand how something is produced or why something went wrong.
If engineering teams are to adequately prescribe continuous optimizations, they will need both time series data (for trend forecasting and anomaly detection) and structured data (for contextual understanding and historical analysis). Integrating these two data types into analyses can facilitate a holistic approach to decision-making in manufacturing, allowing for both predictive and prescriptive capabilities to optimize processes effectively.
Utilizing technologies that provide you with lagged, structured data—like Braincube Digital Twins—drastically reduces the time to value for data analysis. With a holistic data set that is continuously updated with real-time data for analyses, engineers can uncover dependencies, correlations, or causal relationships between various factors. In turn, they can solve complex problems quickly and with more precision.
Want to see how Braincube’s Digital Twins can help you overcome KPI plateaus?
In this quick overview of the types of Digital Twins used in manufacturing, you’ll learn the pros and cons of each type as well as how to choose the right one for your goals.
As food manufacturers continue pressing forward amid tumultuous times, there’s never been a more pressing time for food manufacturers to bring in Digital Twins and Industry 4.0 technology.
Some features of this website rely on services offered by third-party sites. If you give your consent, these third-party sites will add cookies that will allow you to view content hosted by these third-parties on our site. They will collect your browsing data and use the data collected via their cookies for purposes they have determined in accordance with their privacy policy (links below). You can give or withdraw your consent on this page. You can express your choice globally or purpose by purpose.
Necessary cookies are absolutely essential for the website to function properly. This category only includes cookies that ensures basic functionalities and security features of the website. These cookies do not store any personal information.
Analytical cookies are used to understand how visitors interact with the website. These cookies help provide information on metrics, themetrics the number of visitors, bounce rate, traffic source, etc.
Performance cookies are used to understand and analyze the key performance indexes of the website which helps in delivering a better user experience for the visitors.
Preference cookies are used to store user preferences to provide content that is customized and convenient for the users, like the language of the website or the location of the visitor.
Advertisement cookies are used to provide visitors with relevant ads and marketing campaigns. These cookies track visitors across websites and collect information to provide customized ads.


'/%3E%3Cmask id='mask0_48_2551' style='mask-type:alpha' maskUnits='userSpaceOnUse' x='0' y='0' width='24' height='24'%3E%3Crect width='24' height='24' fill='url(%23pattern1)'/%3E%3C/mask%3E%3Cg mask='url(%23mask0_48_2551)'%3E%3Crect width='24' height='24' fill='%23173B57'/%3E%3C/g%3E%3Cdefs%3E%3Cpattern id='pattern0' patternContentUnits='objectBoundingBox' width='1' height='1'%3E%3Cuse xlink:href='%23image0_48_2551' transform='scale(0.00195312)'/%3E%3C/pattern%3E%3Cpattern id='pattern1' patternContentUnits='objectBoundingBox' width='1' height='1'%3E%3Cuse xlink:href='%23image0_48_2551' transform='scale(0.00195312)'/%3E%3C/pattern%3E%3Cimage id='image0_48_2551' width='512' height='512' xlink:href='data:image/png;base64,iVBORw0KGgoAAAANSUhEUgAAAgAAAAIACAYAAAD0eNT6AAAAAXNSR0IArs4c6QAAQABJREFUeAHtnQncrtW4uNtSNCdDk1KKSlQojZqdqJQ0KJUKFXFw4pjSX3WIg0yng4ijMkQKTUTD1rQbqN1M80iTJk27du3/det9trdvv9/3vcMzr2v9fvf3zGvd97XW99z3u571rGfKrFmz5jJJQAISkIAEJJAWgeekZa7WSkACEpCABCQQBAwAbAcSkIAEJCCBBAkYACRY6ZosAQlIQAISMACwDUhAAhKQgAQSJGAAkGCla7IEJCABCUjAAMA2IAEJSEACEkiQgAFAgpWuyRKQgAQkIAEDANuABCQgAQlIIEECBgAJVromS0ACEpCABAwAbAMSkIAEJCCBBAkYACRY6ZosAQlIQAISMACwDUhAAhKQgAQSJGAAkGCla7IEJCABCUjAAMA2IAEJSEACEkiQgAFAgpWuyRKQgAQkIAEDANuABCQgAQlIIEECBgAJVromS0ACEpCABAwAbAMSkIAEJCCBBAkYACRY6ZosAQlIQAISMACwDUhAAhKQgAQSJGAAkGCla7IEJCABCUjAAMA2IAEJSEACEkiQgAFAgpWuyRKQgAQkIAEDANuABCQgAQlIIEECBgAJVromS0ACEpCABAwAbAMSkIAEJCCBBAkYACRY6ZosAQlIQAISMACwDUhAAhKQgAQSJGAAkGCla7IEJCABCUjAAMA2IAEJSEACEkiQgAFAgpWuyRKQgAQkIAEDANuABCQgAQlIIEECBgAJVromS0ACEpCABAwAbAMSkIAEJCCBBAkYACRY6ZosAQlIQAISMACwDUhAAhKQgAQSJGAAkGCla7IEJCABCUjAAMA2IAEJSEACEkiQgAFAgpWuyRKQgAQkIAEDANuABCQgAQlIIEECBgAJVromS0ACEpCABAwAbAMSkIAEJCCBBAkYACRY6ZosAQlIQAISMACwDUhAAhKQgAQSJGAAkGCla7IEJCABCUjAAMA2IAEJSEACEkiQgAFAgpWuyRKQQL0ITJky5bn10khtUiAwZdasWSnYqY0SkIAECieAI5+HQlZAVkJeibwIWQhZsLMcu55tRwDwJPKPjjzctZ7ty5YPcewG5GrkOu7hT7A0SWBgAgYAAyPzAglIIHUCOPqXwCCc/Fh5OfvK/DX/FOVlwcA1rIdEYPBnAoNHWJokMC4BA4Bx0XhAAhKQwFxz4eynwOE1yKYdWZ/lYkidU3Tt3oZcgZyFnI5cTlBgly8gTM8QMACwJUhAAhIYQwCfH933mcPfhPXoym96ugcDzkAiGDidWOCWphuk/qMRMAAYjZ9XS0ACLSCAw38BZmyDbIaE418aaXu6HgP/GQywPIuA4L62G6x9zyZgAPBsHm5JQAKJEMDpx4C9tyDvQrZGnoekmp7G8HhU8APkBIKBx1MFkZLdBgAp1ba2SkAC8Ux/LTCE098ZaUPXft61+iAZ/hT5AYHAxXlnbn71IWAAUJ+6UBMJSKAgAjj9Zcl6N2R3ZOWCimljtldhVPQK/Ihg4O42Gth0m2jbS1E3fx3GDgOAYah5jQQk0AgC3BxjAN+nkM2RGM1vGo5AzFFwChLBwKk4nHj90FQhAdp2vHL6OeQG6uPAYVQxABiGmtdIQAK1JsDNMZ7pfxpZt9aKNlO5v6D2IcixOJ6nm2lCc7Wmbb8Y7cPhvw+JcSwrUQ/Xshw4GQAMjMwLJCCBOhLgxvgc9NoBCce/eh11bJlOMenQwchxBgLF1yztewFK+SjyMSRmkIx0AeyHDnLjH8YkAQlIoLEEuDHOg+yFAeGQfobo/MupzVUo5ljkcvjvgPiIpQDuYI32vR9Z34BEwJU5/yjtqPgzbLIHYFhyXicBCVRKgJvi3CiwNxLP+GOQn6laAjHr4EHIL/lV6oyDI9YF7TsCqh2RzyMr9shuBvuWBPX9PY71tcsegL4weZIEJFAnAtwb10GfPyLfRnT+9aicmC75eOQS6mfLeqjUTC3gtymaX4REj1Yv5x+GnTSK848MDACCgkkCEmgEAW6MiyHfRdnzkTUaoXR6Ska9nEI9/RxZPD3zh7cYXmsgvyWHM5A1J8lppO7/yNtHAJMQ9rAEJFA9AW6K0R26J/IlxMl7gNCQFN3T/8kv1e83RN9K1KR5L0/B/4W8E4m2Plm6mxOWhuvMyU6c6Lg9ABPR8ZgEJFA5AW6O0bV8DhLvoOv8K6+RgRSIbywcSR2eibxioCsTOBkmayE/wtR4tXJXpB/nH2RiYqaRnH9kYg9AUDBJQAK1I8CNcUGUOhj5EPLc2imoQoMSiO8LRH1+JQ/nNWjhdTmfdh1teQfkw0iMZRk0xaRMK8DwtkEvHHu+AcBYIm5LQAKVE+Am+VqUiAFQ/mqsvDZyV+AyctwbB5bUdwZo09F7tQ+yHzLK1ybjGw3vIY+RU60eAQBoT2Sxka0yAwlIoLEEuAfEDXIaovNvbC1OqHjM0zCNej4UmXvCM1twEBtXQ47ElPjFHq/0jeL8Y+bFLyK5pNr0AABoESy6GbkceRMRzhMsTRKQQCIEOveAuFFG96gpDQKnY+Yu3O/vbZO5tOX4cf1WJLr5N8nRtph+eZe88qtTD8BHMGpRZEPEEaN51bD5SKABBLhhromalyA6/wbUV44qbk5ef6L+X59jnpVlFUEssj8KXI/8CsnT+cfkSociuaVa9AAENCy6GYkAIEsHEenEgBGTBCTQYgL8/8evpHi9b94Wm6lpExOIAYL7cc//v4lPq+dR2vAr0SwGq+6BxODVItKJ8Nk2z4zrEgD8P4zq5ex3w+Af52mweUlAAvUgwE0zXhGLG36uN7V6WKcWQxI4gus+xH2/9o+Aab8xydH2yE5I9FxPQYpM68DlwjwLqDwAAGKvX/+ZjdEINsfoc7IdLiUggeYT4P9+Waw4DVm5+dZoQc4ELiC/Hbjv35FzviNnR7t9CZm8HQmnvxFS1mP0M+ARj0tyTXUIAA7EokMmsOrvHFsX46+b4BwPSUACDSHATfRVqBrO/6UNUVk1yydwN0XuyH3/7PKLfnaJtNcXs6fb6Zf95sIsyl8fFvFmTK6p0gAAsAtjzc1IdAVOlML5RxAQwYBJAhJoKAH+59dF9ZORxRpqgmqXR2AGRUUQcFJ5RT5TEu30Raxth8Qv/RjIV7bTp8jZ6SgY7Dl7K8eVqgOAyX79d5sajwHicUDtnw11K+26BCTwDAFuqluydhwyv0wk0CeBJzlvV+770W4KTbTPF1JAt9Ovw+yTD6DTStgfPSK5p8oCAGD3++u/2+gfA2K37h2uS0AC9SfA//vuaPkDpA431foDU8NuAk+xsRf3/mO6d+axTruM7v14Xz9+6W+G1K19/jt2H45ehaQqjY1XJibr+h9r9K5U2PUAOWjsAbclIIF6EuB/9qNo9mWk6FHS9QSgVqMSiO73H9KO5uPe/91RMiOPGHcSI/YzWWWU/Aq+djr5f7vIMirpAaAShvn1383hXUVEg90FuC4BCYxOgP/1mLb0E6PnZA4S+CeBj3Dv/0a/LGh/K3Ju5uxjuXy/11Z8Xgz82wBbzy9Sj6p6AN6DUYP++u/m8H0q9gHglD44pFsJ1yUggfEJ8D8aY3x0/uMj8sjgBL5Ou4qegDnmw2d/9DC9Cul2+EsNXkQtrji6aOcfVlbVA/BHyn79iJhjhOhWQDpjxHy8XAISyJkA9+J9yPKInLM1OwlkBOLV8ZA1kMzhv5H1GMjX9FTowL9uOKUHANwYoksmr3f6HyGvfysjUuqG5roEJDA+Af7HYyR1jNqOZ7cmCRRF4FEybuMbJfvi00Ya69Av8Of0e2KO5+2SY14LkNep3HBel2OeZiUBCQxJgP/F+DX2E0TnPyRDL+ubQBud/6/Kcv5BuYoegKsoN57T5JniU5IbAy7yNklAAhUQwPmvRrExc1tM722SgAQGIxBTH6+GH7tvsMuGP7vUHoDODSJv5x/Wx6xNvyf/eLxgkoAESibA/16Mrv4tovMvmb3FtYLA01gRH78rzfkHtVIDAMrLs/s/9O9OS7JxOjeiZbp3ui4BCRRLgP+5mEzlNCT+B00SkMDgBL6I8586+GWjXVHqIwBuFDeh7nKjqTzp1THAcENg3jnpmZ4gAQmMRID/6XnI4A/IuiNl5MUSSJdAfP3wjfismWUjKK0HgBvFOhi3XAkGvoIy4nGAHxspAbZFJE/gUAjo/JNvBgIYksBDXPfOKpx/6FtaAEBZu0SBJaVXU85pBAEx46BJAhIogAD/X1uTbUzza5KABIYj8H6cf/SMV5JKeQTAjSICjRjhuETJVp5LeVsAON4XNUlAAjkR4H86xtrEXOX2tOXE1GySI/A1fNP+VVpdVg/AxhhZtvMPrhsgv+FmtVBsmCQggdEJ8P8UU4j/DNH5j47THNIkcDxmf6xq08sKAMrs/h/LNCYmOYObljersWTclsBwBHzuPxw3r5JAEDgfiVf+4tW/SlNZjwD+hpVV9AB0w72CjTcB/a7una5LQAL9EyCQ3oqzT0Km9H+VZ0pAAh0C17JcDz/09zoQKTwA4IYR31++rQ7GokO8IrgZ8OuiT02wqIYEJifA/3I8978UacMHVyY32DMkkC+Be8huHfzPjflmO3xuZTwCWHN49XK/Ml4RPJcbmTMG5o7WDBMgcDQ26vwTqGhNzJ1ADETfuk7OPywsIwBYK3eUo2W4LJefQxAQrwqaJCCBPgjw/7I7p23cx6meIgEJPJtAPOuPd/0vevbu6rfKCADq1AOQEY/xCFO5qdVRt0xHlxKoBQH+T2J+/y/XQhmVkECzCDyFunvh/H9dR7VTDQCiLqIrM94OeGMdK0adJFAjAp9Dl8VrpI+qSKAJBJ5EyZ1x/kfXTVn83mrIroUOAqSA5TG8NgMexqmEeDazHZX0u3GOu1sCyRLgf/h1GB9dl3MnC0HDJTA4gce5ZAf8yimDX1rMFfwvz0/O70D2QVZG1ogJPYpMdXv+38vWgHIScN5BZf2q1wnuk0CKBPifiFf9voXo/FNsANo8LIFHuHAb/MmZw2aQ53X8G69GfuH0d0Oyz3Vvj363FP0IoCnP2OcFzHGAehdLkwQk8AyB97JYWxgSkEDfBB7kzJhvplLnjy+bH9kLmYY+lyEfQDLn/y30O4HtuYp+BBAQNomCGpQOAc5nG6SvqkogdwLcOGKMzF8QX/vLna4ZtpTAvdgV3565pCr7+L/t9Wu/W50IBmIugnhEUVwAgCLRffgAsnAU1LD0E/R9N5BmNExv1ZVALgT49z2SjN6TS2ZmIoH2E7gdE8P5X122qfyvdj/bX2eC8uPRxJro+OfsnMJ6AFBqJQqZXVBWYIOW56Hr24AVUZ1JAskQ6Pzvxo2s6EeEyTDV0FYTOBvrdsRX3F2WlfyPLkpZ8Tnu7ZAtkAWQyVK8jvjD7pOKHATYlOf/3Ty619dn4wJAbwW06Ao1SSAVAp/GUJ1/KrWtnaMQOJyL/wMfMXOUTPq5Fl+0NOdti4TT3wiZB+k3/Wis848LDQAmxrcCh6cB/u3AmzrxqR6VQPMJ0Nbj1d13Nt8SLZBAoQTi8fD7ejnVPEvl/zF60sPhh8RbdfFofdAU38B5f6+LigwA4iNAbUgvwIjfURF7U9lHtcEgbZDABAQ+wbEi7wsTFO0hCTSCwO1oGT8KL85bW/xMOPjoPc+cfryvP0qKQCVecX+4VyZF/qOH42xLiq6WH1I38TGhA4E5qy2GaYcEMgK07+hi3DPbdikBCcxB4Bz2xPP+3D4rz/9dvJ63HrIV8jYk/g/zSh9H10vHy8wAYDwyvfcfwO4VqbA9gfrP1yh6n+ZeCTSSwMfQ+nmN1FylJVAsgfjR9w0kHOqToxSF/1iK6zdAYhr6WMare0WMuTkRXb9J3uOmIt8CuJFS43liG9M0jNoWuPe00ThtSo8AN6UXY/XNSLxSZJKABP5F4HpW38P9Pkb7D5z434pu/MzZh8N/+cCZDH7BbVyyBjrfN9Gl9gBMRGf8Y+tyKN4QiCDgyvFP84gEGkNgfzTV+TemulS0BAJPU0b8gj6A+3x8M2bShE8Inxrfz+h2+C+a9MJ8T3iK7OLzwxM6/yiykB4AIER3RnSTFNGtEXrXJUWjiJGgx9RFIfWQwKAE+H+Nd4pvQZo4adeg5nq+BPohcC0nxWRwMR9Mz8T/TXTlr4LEL/yQVyNvQKoOpGOc2ufQY9JUVA9ADGpou/MPuFHRR9MQ1mf5YaDHiEuTBJpG4N0orPNvWq2pbxEE4lf/15Bwoo9xb48B4Csi4eC7nX1sL4TULZ2GQof2q1RRPQAvR4Eb+lWiJef9ETtidOjNLbFHMxIhwE3uMkxdLRFzNVMC4xF4ggM/RO5HMmcfvqyoH8pknWuK/+MN8UEP9ZtrUQFAPAP5U79KtOi8eOayOxVwaots0pQWE8D5r45501tsoqZJIAUCMehvXXzPHYMYW1Q3fZvmABiE52KcfDI31c8hRbEdRB/PlcBkBHaf7ASPS0ACtSbwINptOajzD4uKclKpBgDBNGZyivkCYvbAeLXKJIFaEqB9zo1iu9ZSOZWSgAT6IRCPLbbD+Q/1NpoBQD+IhztnMy67lJvsesNd7lUSKJzAmyhhicJLsQAJSKAIAjE5UbypcNawmRsADEuuv+uW5rSpBAEf6e90z5JAqQTeVWppFiYBCeRJIOYn+PEoGRoAjEKvv2vn4bSvEQQch9TxtZH+rPCsVhGgLcZrfzHvuEkCEmgege/g/L8wqtpFBQCj6tXG63fAqMu48cZUkCYJVE0g2uN8VSth+RKQwMAETuaKDw58VY8LigoAHuhRlrue+TbCHwgCvojMKxAJVEjA0f8VwrdoCQxJID5BvDO//mO635GTAcDICAfOIJjHN9cvIgiIqSNNEiiVAO0uHkXZE1UqdQuTwMgE4gN7W+P8Hxk5p04GBgB5kRw8n5iA5Y/cjD+KFFUPg2vlFSkQ2BAjmzK7WQr1oY0SmIzA3znhLTj/uyc7cZDjRTkeHwH0Vwvx7fWvIGcQBLysv0s8SwIjE9h05BzMQAISKIvA4xQUX569Nu8CDQDyJjpcfhtz2eUEAb6WNRw/rxqMgAHAYLw8WwJVEXiagnfD+Z9XhAIGAEVQHS7PeC3rKIKAXyAvHC4Lr5LAxAQ6bSseP5kkIIH6E9gf5398UWoaABRFdvh8t+fSK7lRbzl8Fl4pgXEJbMyRmK7aJAEJ1JdAzPL3EZz/N4pU0QCgSLrD5x3Ts55CEPAdxMmDhufolXMSsPt/TibukUCdCES3/95FO/8wuJAAAMVnkHcMXDCNRmBfLr+GICB6BUwSyIOAAUAeFM1DAsUQmEm278SHfr+Y7J+dayEBQKcI3wR4Nutht+J7AjEuID4zvNywmXidBGg/S0JhZUlIQAK1JBA/nN+O8/9ZWdoZAJRFevRytiKLq7iJfxKJ7wuYJDAogU0GvcDzJSCBUgjE5D5b4fxPKqW0TiEGAGXSHr2s+ckiPgARnxl2JrfReaaWwxqpGay9EmgAgQfR8d9w/meUrWuRAUCuMxaVDabm5a2KfmcTBByJLFZzXVWvPgRWqo8qaiIBCUDgXmQTnP/5VdAoMgC4ogqDEiozXuV6D/IXgoA9ErJbU4cn4PP/4dl5pQTyJvBXMtwQ539p3hn3m1+RAUBlRvVrfEvOexF2/JAgYCriDb4llZq3GbSNmPv/5Xnna34SkMBQBG7mqjfi/K8Z6uqcLjIAyAlkDbLZCB0u40b/OcTvvNegQmqmwgro4weAalYpqpMkgb9gdTj/G6u2vsgA4CaMi8ENpvIIzEtRByDXEQTshRRZv+VZZUl5EPD5fx4UzUMCoxG4jMuj2//20bLJ5+rCHAQGxlSG0/NR01wGJBBzB/wAmU4Q8JYBr/X0dhIwAGhnvWpVcwhciKox4K82A+QLCwA6deI4gGob52so/lSCgNOR11ariqVXTMAAoOIKsPikCZyF9Zvj/O+vEwUDgDrVRnG6bEbWfyIIOAZ5WXHFmHONCRgA1LhyVK3VBP4X67bA+T9cNyuLDgB8BFCfGo/XBndD4rXBLyOL1kc1NSmBgAFACZAtQgJdBOJ7OHvi+D+IPNm1vzarU1CsMGVwMjHqOKKe5xVWiBkPS+A+Lvw8cjht4IlhM/G6+hPg/zBmkIypRk0SkEA5BG6hmJjX/5JyihuulEJ7ADA+vmx05XCqeVXBBGIGwcOQP+MgdkGih8DUTgJ+Urqd9apV9SQQU/quWXfnH+gKDQA6deNAwA6Imi6WR6+fIH8kBtjWQKCmtTSaWgYAo/Hzagn0S+DLnBjP+2OK39onA4DaV1FpCr6Okn6FxGRCOyNltI3SjEu8IAOAxBuA5hdOIB6x7YTj/zjyVOGl5VRAGTf5ePfR1BwCr0HVnyLXEATshfjp4ebU3XiaLjjeAfdLQAIjE7iOHNbG8R83ck4lZ1B4AACUP2FTDIgwNYvAK1E3JhOKWQXfjziQs1n1162tPQDdNFyXQH4ETiartfBzV+WXZXk5FR4AdEw5vjyTLClnAjFvwLeQmwgC9kcWyDl/syuegAFA8YwtIS0C8frcQcg2OP/GTnlvAJBWox3F2iW5+DDkZoKATyOLjJKZ15ZKwEcApeK2sJYTCIcfjv9gpLj36EuAWFYAMA1b7ijBHosonsCLKCLmD7iFIOC/kBcWX6QljEjAHoARAXq5BDoEoqs/uvyj67/xqZQAoBMlndB4WhrQTSB6AD6D3EoQ8D1kje6DrteKgAFArapDZRpK4Hz0jsF+MeivFamUAKBD6hetIKYRYwnELHPvRS4lCDgXiUmFfHNgLKVqt30EUC1/S28HgWtw/q2aUbPMAOBc2sBd7WgHWjEOgfXZH5MKRa/AIcjS45zn7nIJNPo5ZbmoLE0C4xKYd9wjDT1QWgBA5PQ0jHwM0NCGMqDaS3D+gUgMGDwO2XjA6z09XwIP5ZuduUkgSQKt69ksLQDoNJfjk2w26RodH4PaATmLIOBKJOYTsDu6/PbQ2NeUykdliRIYl4ABwLho+jswldPu7e9Uz2oZgVWxJ+YTuIMg4JvISi2zr87m2ANQ59pRt6YQMAAYpaZ4DBBzJMd886Z0CSyM6f+OxFcIY9Dgvkh8mdBUHAF7AIpja87pEHAMQA51/fMc8jCLdhCIQYPfQf5GEPBLZHvEKYfzr1t7APJnao7pEbAHIIc6P508rs4hH7NoD4GIrN+GxKuidxIEfBfZEJnSHhMrtcQegErxW3hLCBgAjFqRPAaIV5L+e9R8vL61BBbFsr2RPyDxFsGhyKtaa205htkDUA5nS2k3gdY9ApjyjD8ut9a4oUckdQOyTLklW1qDCVyC7j9CfkqbvbPBdpSuOv9vMX3zPaUXbIESaBeBP3HvWbNNJpX9GuA/2QHxSVYOaxNIbSmcwOso4avI7Ti03yHxSqEBZH/Y7QHoj5NnSWAiAq17BFBJD0AQ5uYdn5W9BfFjMgHENCyB6Vx4EhIf57iY4NJZ73qQ5P/tMXY/v8chd0lAAv0R+DO3l1X6O7UZZ1XSAxBoABlzKh/eDExqWWMCa6DbgciFyF9xdEci23YCzBqrXbpq9gKUjtwCW0bAHoA8K5SbdPz6j16A6A0wSSBPAo+T2ZlI9AycRMB5e56ZNy0v/teip2T1pumtvhKoEYGbuI+8vEb6jKxKZT0AoTkw/87iyJGtMAMJzEkguru3RGL2wdtwgPG1wvhA0VpIpe1+TlVL2XNlKaVYiATaS+CJtplW2RiADCQ34xjIdQPSuu6VzEaXtSMQ78XH1ynP7kiM7o2Bqa1N/J99EuO+0FoDNUwCxRO4kvvEa4ovprwS4mMtlSaAxq+zn6LEuypVxMJTIrAIxm7VkbD7EdrgNJZZQHAh7TIeIbQp2QPQptrUlioI2ANQBHVuvjHRS9ygnPmtCMDmOSiBGVxwERIBQUxIdD4BQQxabWzif2w5lL+psQaouASqJxA/DNapXo38NKj8EUBmSqcXYOds26UEakRgJrrEREQRDERPwXRuBI1ypvx/RXAdjz4WQkwSkMDgBM7h/37DwS+r7xV1CgCWBNM1SHTPmiRQdwLhTC9DYnR9SKxfxQ0ieg9qmYgBLkCxtWupnEpJoP4EzuT/e7P6q9m/hpWPAchUBWx8Ee5TbMeobZME6k4gAtX4NdD9i2AmbTiC2Cwo+GdgQNuOt13qkK5ACQOAOtSEOjSRQOvGANQmAOi0hu+wjMGArXrO0sSWrs5DEYj/pxglHLJ7lgNBwe2sZ0HBn1m/MYTA4K7snJKWDgQsCbTFtJJA694UqlUAwA1xFjfLfWg68by1Vrq1sjlrVFkEXkpBIVt3F0hbf5TtfwYDPZY38+/wWPf5OawbAOQA0SySJWAPQNFVz03vCm6Mh1HOJ4ouy/wlUDGB+Sn/1R0Zq0oEw39j59gAIfbd25G/DxgkGACMpey2BPon0LoegNoMAuyuA25887F9FbJ8937XJSCBOQhEL0IEBDHOYHZgMM56HL8ceQFikoAEBiNwNAH3HoNdUu+za9nNHr9qCAL2A91v6o1P7SRQOYHoRVi2I5UrowISaDGB1vUA1HZOdIKA39KQjm1xY9I0CUhAAhJoDoG8x+RUbnltA4AOmY+wfKBySiogAQlIQAKpE7ivbQBqHQDQCxCvSX2ybdC1RwISkIAEGkcgxtm0KtU6AOiQ/i7LE1tFXWMkIAEJSKBpBOwBKLvG6AWYRZm7IVeXXbblSUACEpCABDoEDACqaArEAP+g3G2R+6so3zIlIAEJSCB5AgYAVTUBgoDrKXtn5KmqdLBcCUhAAhJIloBjAKqseoKA31G+MwRWWQmWLQEJSCBNAq3rAajlTICTtS0mCTqac2Z/bGWy8z0uAQlIQAISGIFAjEWbhx+hreqBbmoA8Hwq42xkrREq1EslIAEJSEAC/RB4AOffuim0m/Aa4ByVQ0U8zs7tkDvnOOgOCUhAAhKQQL4EWtf9H3gaGQCE4gQBd7B4O9K6TzSGfSYJSEACEqgNgdYNAAyyjQ0AQnmCgGks4qNBJglIQAISkEBRBOwBKIrsKPkSBHyf6z82Sh5eKwEJSEACEpiAQHxKu3Wp0T0AWW0QBBzG+r8jMVLTJAEJSEACEsiTwG15ZlaXvFoRAARMgoDDWeyLPB3bJglIQAISkEBOBG7NKZ9aZZN7AMA7+puHVGElQcD3KHcvpFXvalbB0jIlIAEJSGA2AXsAZqOYeGVVDv+eIOACZOuJT83/KEHA0eS6KzIz/9zNUQISkIAEEiRgD0Cflf5o57y1WZ5EEDAd2RHJvbdhPH0IAn7GsR0RXxEcD5L7JSABCUigXwIGAH2SenjMeauz/XPkKoKAdyHPHXO8kE2CgF+RcUwWFJMGmSQgAQlIQALDEHgYf/LAMBfW/ZoifpWPDQAyBiuzchRyLUHAvsi82YGillTaqeT9ViTrlSiqKPOVgAQkIIF2Emjlr/+oqjIDgKxpLM/Kd5AbCQI+iiyRHShiSRBwOvm+BXmoiPzNUwISkIAEWk3AAGCA6h2vB2BsFkuz4yvIHQQBZyB7Iy8ce1Ie2wQBZ5PP65HpeeRnHhKQgAQkkAyBVr4BELVXRQ/A2FYTOmyKfBf5G0HAqUiMFVh47ImjbBMEXM/16yJHjpKP10pAAhKQQFIEbm2rtUUEAI+MAGsero3u+hgrcDdBwAnITsj8I+Q5+1KCgMeRvdmxB+K4gNlkXJGABCQggXEItLYHYAoOcRybh9uNs16MK/P+clIEFSchJyLT0PlmliMl9Iz5Cn6BxOBEkwQkIAEJSKAXgU3xOWf1OtD0fUUEADG6f0bBYO4i/wuRCzrLi6mgfwxaJkHAglwTjx52GfRaz5eABCQggSQIrIB/ubGNluYeAAQkHGu8M7lIicBi/v+rkCwoiMDgGiqtr+8CoG98UviryPMQkwQkIAEJSCAIxI/ZBfAlrZxevqgA4BKgvTboVZjitb8Y9X8HcucYiR6E2HdPFiQQBKzJ9nHIcohJAhKQgAQkcDk+Iiaza2Uqala+6C6pOgCItwg2nKTWnsLx38M5WYBwGevLIkUMjpxEFQ9LQAISkEDNCFxTM31yVafIACBXRQvKbG7yjYmICp2MqCDdzVYCEpCABIolcHWx2Vebe1G/dKMHwCQBCUhAAhJoMgEDgCFqzwBgCGheIgEJSEACtSLQ6kcARfUA3FSrKlQZCUhAAhKQwGAEZnL6dYNd0qyziwoAbgbD081CobYSkIAEJCCB2QSu5w2AJ2ZvtXClkAAAaE/C6vYW8tIkCUhAAhJIg0Cru/+jCgsJADpto/Xw0vgf0EoJSEACSRJo9QDAqNEiA4CYjc8kAQlIQAISaCIBA4ARam3aCNd6qQQkIAEJSKBKAq3vxS5kKuCoMWbYi28B3B+rsW2SgAQkIAEJNIRADGJfkPFsjzVE36HULOwRAOAeRKPWd6EMRd2LJCABCUigzgT+0nbnH/ALCwA6NetjgDo3cXWTgAQkIIFeBC7utbNt+4oOAM5vGzDtkYAEJCCB1hMwAMihiu0ByAGiWUhAAhKQQKkELiq1tIoKK2wQYNjDQMAYAPh35AWxbZKABCQgAQnUnEBMZLcQYwBm1FzPkdUr9BEAAGeh4dSRtTQDCUhAAhKQQDkELk/B+QfKQgOATl2dUE6dWYoEJCABCUhgZAJJPP8PSmUEACdTTnSpmCQgAQlIQAJ1J5DE8/+ohMIDALpSHqCcs+pe4+onAQlIQAISgIA9ADk3Ax8D5AzU7CQgAQlIIHcCj5Bj66cAzqgV3gPQKejXLGNqRZMEJCABCUigrgQuodf6qboql7depQQAAL0TxZ0TIO/aMz8JSEACEsiTQDLP/wNaKQFAp3Z+mWctmZcEJCABCUggZwLJPP8PboVOBNRdMcwJtDzbN3bvc10CEpCABCRQIwLL0mN9W430KVSV0noAgHoTlvg2QKHVaeYSkIAEJDAkgRtScv7BqLQAoFMh/ztkxXiZBCQgAQlIoEgCU4vMvI55lx0AxNsAt9cRhDpJQAISkEDSBJLroS41AKB7ZSbN64ikm5jGS0ACEpBAHQkkFwCUNggwq20GAy7O+q3IvNk+lxKQgAQkIIEKCVzLD9SVKiy/kqJL7QEIC4F8F4vjK7HWQiUgAQlIQAJzEpg656727yk9AOggPbz9aLVQAhKQgAQaQiC57v+ol9IfAWSNgUcBl7K+RrbtUgISkIAEJFARgSXpnY4Za5NKVfUABOQvJUVaYyUgAQlIoI4ErknR+UdFVBkAHEv5V9SxNaiTBCQgAQkkQ2BqMpaOMbSyAICIaxa6fGaMPm5KQAISkIAEyiSQ5PP/AFzZGICsdhkLcAHra2fbLiUgAQlIQAIlEYgfoovze/SeksqrVTGV9QB0UTiga91VCUhAAhKQQFkELk/V+QfgygMA4J+BHmeWVduWIwEJSEACEugQOCllEpUHAB349gKk3Aq1XQISkEA1BAwAquH+r1LpBYhxAElXxL9ouCYBCUhAAiUQiPf+Ly6hnNoWUZcegAD0MWRGbUmpmAQkIAEJtInAyfz4jEGAyabaBADUw7XUwueTrQkNl4AEJCCBMgmcWGZhdSyr8tcAu6HwSmB8IXA6skr3ftclIAEJSEACORJ4jLxeyA/PWCabatMDEDVAZTzBYp9YjW2TBCQgAQlIoAACp6fu/INprQKAUIhKOZfF92LdJAEJSEACEiiAQPLd/8G0Vo8AskrmUcCirF+DLJHtcykBCUhAAhLIgUD0MC/Fj814CyDpVLsegKgNKuYBFh9OumY0XgISkIAEiiBwsc7/Gay1DABCNSro5yzspnmmnvwrAQlIQAL5ENCvdDjW8hFAVsc8CliM9UuQl2X7XEpAAhKQgARGILA6PzAvH+H61lxa2x6AIEwl3cdiRyTeDjBJQAISkIAERiFwk87/X/hqHQCEmlRWTNW4/79Udk0CEpCABCQwFIFjh7qqpRfV+hFAN3MeB/yU7Z2797kuAQlIQAISGIDAavyovGKA81t9apMCgAWpiegNWLnVNaJxEpCABCRQBIGrcP6vLiLjpuZZ+0cAGVgq7mHWd0Aeyfa5lIAEJCABCfRJIHqRTV0EGhMAhM4EAVex2LtLf1clIAEJSEAC/RDw+f8YSo0KAEJ3goCI4j49xg43JSABCUhAAuMRuAjfccN4B1Pd37gAICqKivwCi8NTrTTtloAEJCCBgQjY/d8DV2MGAY7VnbcCIniJ2QK3H3vMbQlIQAISkECHwNMsX8oPx79J5NkEGtkDECZQmVGpuyJnx7ZJAhKQgAQk0IPAH3T+Paiwq7EBQJhDpc5gsS1yZWybJCABCUhAAmMI2P0/Bki22dhHAJkBseRxwNIspiHLxLZJAhKQgAQkAIEnkSX4sRjTypvGEGh0D0BmC5V7B+ubI7dl+1xKQAISkEDyBE7T+Y/fBloRAIR5VPK1LNZHYmmSgAQkIAEJ/FgE4xNoxSOAbvN4HPBitk9DXtu933UJSEACEkiKwL1YG6P/Y6yYqQeB1vQAZLZR2fewvglyTrbPpQQkIAEJJEfgKJ3/xHXeuh6AzFx6AuZj/RfIltk+lxKQgAQkkAyBlTqPhpMxeFBDW9cDkAGg4h9j/W2I8z9nUFxKQAISSIPAVJ3/5BXd2gAgTKcBxCsguyL/HdsmCUhAAhJIgsARSVg5opGtfQQwlguPBOJTwv+HLDj2mNsSkIAEJNAaAjH4b2l+AD7RGosKMqTVPQDdzGgMMR5gHeS67v2uS0ACEpBAqwj8UOffX30m0wOQ4aAnYBHWj0Hemu1zKQEJSEACrSHg4L8+qzKZHoCMB5Hhg6zH9wMOQmYhJglIQAISaAeBs7jHOxlcn3WZXAAQXGggkQ5mdRvEOaIDikkCEpBA8wl8t/kmlGdBco8AxqLlkcDi7Ps2st3YY25LQAISkEBjCDj4b8CqSrIHoJsRPQF3IW9n385INCCTBCQgAQk0j4CD/wass+R7ALp50RsQ3xH4FhKvDJokIAEJSKAZBJ5GzRj8d30z1K2Hlsn3AHRXA43nHmRH9oXc3X3MdQlIQAISqC2BX+v8B68bA4AezGhIMWfAqki8LuibAj0YuUsCEpBAjQgcViNdGqOKjwAmqSoeC7yOU76MbDrJqR6WgAQkIIHyCVzIj7aY5M00IAF7ACYBRsO6BNmM07ZCrpzkdA9LQAISkEC5BL5SbnHtKc0egAHqkt6ACJj2RA5BlkZMEpCABCRQHYGbKPoV/Eh7qjoVmluyPQAD1B2N7GnkB1zySuQzyEMDXO6pEpCABCSQL4Gv6/yHB2oPwPDs5qJHYGEufw/yIWQ5xCQBCUhAAuUQuJ9iliEAeKSc4tpXij0AI9QpDe8h5GtksSIScwecP0J2XioBCUhAAv0TOELn3z+sXmfaA9CLygj76BV4A5f/BxIBwXNHyMpLJSABCUigN4En2L08AcBfex92bz8EDAD6oTTEOQQCy3DZ+5BdkOWHyMJLJCABCUigN4GjcP579j7k3n4JGAD0S2qE8wgG1uLydyA7IREYmCQgAQlIYHgCqxEAXDH85V4ZBAwASmwHBAJTKG5dJIKBmG54ScQkAQlIQAL9E/gdzn+L/k/3zPEIGACMR6bg/cQCMQDzjciWyEbI6xHHDADBJAEJSGACAhsTAPxhguMe6pOAAUCfoIo+jYBgQcpYD4lgYGMkHhvMg5gkIAEJSOAZAmfi/GNmVlMOBAwAcoBYRBYEBPOT767I/sjKRZRhnhKQgAQaRmADAoDzGqZzbdW1y7kmVYPDXxZV1uySeCSwWE3UUw0JSEACVROIZ/86/xxrIYkeAJxrdBm9GrmuIzfRkGbmyHGgrNAnviMQzj6cfOb0XzxQJp4sAQlIIC0C63DfvjAtk4u1NpUAID7p+6culOH8b0aygCBb3s6+hzOhsc1gfdKEQ5+bkxZBXjCJLMXxcPpLICYJSEACEuiPwKncj+OLrKYcCSQRAAQvnPRVLF41ILsIFGYHBF3rs1hfFMkcfnwTIF7xM0lAAhKQQP4E1iIA+GP+2aadY0pjAH5EVR86YHUHn3D0ISYJSEACEiifwIk6/2Kgp9QDEIPsbkb8pV5MWzJXCUhAAnkTiN7W1xEATM87Y/Oba65kvgZIA7qVCj/bSpeABCQggcYQ+KXOv7i6SiYA6CA8pjiU5iwBCUhAAjkSiF//B+WYn1mNIZBaAPAL7H98DAM3JSABCUigfgSO49f/FfVTqz0aJRUA0JgepOp+1p7q0xIJSEACrSTwFFYd1ErLamRUUgFAh/tXasRfVSQgAQlIYE4CR/KD7Zo5d7snTwLJvAXQDY05AX7D9pu797kuAQlIQAK1IPAPtFiRAODuWmjTYiVS7AGI6vxyi+tU0yQgAQk0mcChOv9yqi/JHoBASy9ATA0cUwSbJCABCUigHgRuQY2VCQAcrF1CfaTaAxBoHQtQQgOzCAlIQAIDEPiUzn8AWiOemnIPQEzzez3yshEZerkEJCABCYxOIL70ty4BQLz/byqBQLI9ALSx+NCPvQAlNDKLkIAEJNAHgf11/n1QyvGUZHsAgiHjAOZhEa+arBDbJglIQAISqIRATPqzUyUlJ1xosj0AUec0uCdZfDLh+td0CUhAAlUTmIECn6haiRTLTzoAiAonCIjpgaelWPnaLAEJSKAGBP6H+/BNNdAjORWSfgSQ1TaPAtZj/bxs26UEJCABCZRC4F5KiUl/Ypp2U8kEku8BCN40vvNZHF8ye4uTgAQkkDqBg3T+1TUBewA67OkFWJHVq5EYGGiSgAQkIIFiCcRkbGsTAMSHf0wVELAHoAOdRhhzAhxeQR1YpAQkIIHUCITT30fnX221GwA8m/+BbDoY5dlM3JKABCSQN4Fv4vwvyTtT8xuMgI8AxvDiUcAm7DoDmTLmkJsSkIAEJDA6gdvI4lUEAA+PnpU5jELAHoAx9GiUZ7HriDG73ZSABCQggXwIfFDnnw/IUXOxB6AHQXoBFmL3lciyPQ67SwISkIAEhiNwAs5/++Eu9aq8CRgAjEOUIOBNHPrdOIfdLQEJSEACgxF4iNOj6/+OwS7z7KII+AhgHLI00t9z6PvjHHa3BCQgAQkMRuAAnf9gwIo+2x6ACQjTC7Awh2Okqh8LmoCThyQgAQlMQuAijsenfp+e5DwPl0jAHoAJYNNYo8tqB+TxCU7zkAQkIAEJjE8gPr2+r85/fEBVHTEAmIQ8jXY6p3xgktM8LAEJSEACvQl8vXMf7X3UvZUR8BFAn+h5HBDjAd7d5+meJgEJSEACc811MxBWJQB4VBj1I2AA0GedEAA8n1Pjs8Fr9HmJp0lAAhJImcAsjN8U5z81ZQh1tt1HAH3WDo04xgHEeAA/W9knM0+TgASSJvA1nX+9698egAHrh56Abbjkl4jB04DsPF0CEkiGQHxZ9fWdH07JGN00Q3ViA9YYDfpELvnwgJd5ugQkIIFUCDyJobvr/Otf3QYAQ9QRDftwLvv8EJd6iQQkIIG2EziEe6Rf+mtALfsIYIRK4nHAkVz+nhGy8FIJSEACbSJwIcasTwDwVJuMaqstBgAj1CwBwNxcfgIS4wJMEpCABFImEK/6vRbnf23KEJpku48ARqitTpS7M1mcN0I2XioBCUigDQQ+rvNvVjXaA5BDfdET8AKymYqslkN2ZiEBCUigaQTi42lbEADEu/+mhhAwAMipoggCFiOr3yJr5ZSl2UhAAhJoAoH7UfI1+H4/89uE2urS0UcAXTBGWaXx38f1myFnj5KP10pAAhJoGIEP6vwbVmMddQ0Acqw3/gn+QXZvRk7LMVuzkoAEJFBXAj/lvveTuiqnXhMT8BHAxHyGOsrjgHm58Fhku6Ey8CIJSEAC9SfwZ1RciwDg4fqrqoa9CNgD0IvKiPv4h3iCLHZCfjxiVl4uAQlIoI4E4pW/HXT+daya/nUyAOif1UBn8o8xkwvehfz3QBd6sgQkIIH6E3gf97ir6q+mGk5EwEcAE9HJ6RiPBHYlq5g1MD4pbJKABCTQZALfw/nv02QD1P0ZAgYAJbUEgoA1KepXyNIlFWkxEpCABPImcCkZrkcAEJ9HNzWcgAFAiRVIELAkxcWnhNcusViLkoAEJJAHgQfJJD7xe0MemZlH9QQcA1BiHfCP8zeK2wg5usRiLUoCEpBAHgT21PnngbE+eRgAlFwX/APNQPag2P2QGElrkoAEJFB3Aodx34pHmKYWEfARQIWVySOBV1J89Ab4SKDCerBoCUhgQgLxsbONCQDizSZTiwjYA1BhZfIPFZ/N3AD5LOI/V4V1YdESkEBPAvew9x06/55sGr/THoCaVGHnLYFjUGflmqikGhKQQNoEnsL8t+D840t/phYSsAegJpXKP9kfUeV1yP8gflKzJvWiGhJImMBHdf7trn17AGpYv/QGxCeFIxBwbEAN60eVJJAAgSNw/u9LwM6kTTQAqGn1EwRMQbU9kS8iL0FMEpCABMogcCaFbEEA4LikMmhXWIYBQIXw+ymaOGARzjsI+SDyXMQkAQlIoCgCMTB5HZz//UUVYL71IWAAUJ+6mFATAoFVOeEbyGYTnuhBCUhAAsMRCKe/Ns7/uuEu96qmEXAQYENqjH/Kq5DNUXdT5KyGqK2aEpBAMwg8iZrb6/ybUVl5aWkAkBfJkvLhH/QsJIKAmD/gtyUVazESkEC7CXwg7i3tNlHrxhIwABhLpCHb/LOeh7wFdeONgRMRXx1sSN2ppgRqRuBr3Eu+VzOdVKcEAo4BKAFyGUUwRmB1yvkPZCdkvjLKtAwJSKDxBE7Bgm0IAJ5uvCUaMDABA4CBkdX7gs5bA7uh5d5IBAUmCUhAAr0IXMnO9XD+/+h10H3tJ2AA0OI6JhiIxwMRCOyCLNhiUzVNAhIYjMBdnB4j/m8Z7DLPbhMBA4A21eY4thAIhPN/B7IDEgMI50VMEpBAmgQexOz4ut/0NM3X6oyAAUBGIpElwcBCmLoFsi2yJbIYYpKABNIg8Bhmxix/56RhrlZORMAAYCI6LT9GMBAzC8brhBEMbI2siJgkIIF2EoipfbfD+Z/cTvO0alACBgCDEmvx+QQEi2Peul2yJuu+UdDiOte0ZAjEa8J74Pzjk+MmCfyTgAGADWFcAgQE83Aw3iSIoGAdZGUkegkWRkwSkEBzCHwE5x9TiZskMJuAAcBsFK70S4DA4EWcG4HACmOWS7K9CBIBwtyISQISqJ7A53D+B1avhhrUjYABQN1qpCX6ECTEmwcRDGTyUta/isTSJAEJlEPg2zj//copylKaRsAAoGk11kB9CQbegNo/QaLHwCQBCZRD4GcU804CAGf5K4d340rxWwCNq7LmKIzjfw7yKTQ+D9H5N6fq1LT5BE7DhN11/s2vyCItsAegSLoJ543jXxrzj0E2SRiDpkugCgLTKHRznP+jVRRumc0hYA9Ac+qqMZri/LdD2csRnX9jak1FW0LgT9ixlc6/JbVZsBkGAAUDTil7HP98yHew+QTEGQZTqnxtrQOBC1FiM5z//XVQRh3qTyBmgjNJYGQCOP7VyeSnyCojZ2YGEpDAoATO5YItcf5+2W9Qcgmfbw9AwpWfh+k4/kgfJq/49aHzzwOqeUhgMAJTOf3NOv/BoHn2XHPZA2ArGJoAjv8lXPxD5C1DZ+KFEpDAKAR+z8Xb4vzjIz8mCQxEwB6AgXB5ckYA5/9m1mOgn84/g+JSAuUS+A3FbaPzLxd6m0ozAGhTbZZgC45/YeR/KOpUJD4eZJKABMoncCJFvg3n/3j5RVtiWwj4CKAtNVmCHTj+XSnmK8gSJRRnERKQQG8Cx7N7F5z/k70Pu1cC/REwAOiPU9Jn4fhfBYBvIRslDULjJVA9gWNRIWb4m1m9KmrQdAI+Amh6DRaoP45/QeRLFDEd0fkXyNqsJdAHgZhZczedfx+kPKUvAvYA9IUpvZNw/DtitV/vS6/qtbieBL6NWh/E+fthn3rWTyO1sgegkdVWnNI4/lciv6OEnyN+urc41OYsgX4JHIDj30/n3y8uz+uXgD0A/ZJq+Xk4/fkw8QDkP5F5W26u5kmgCQRikN97cfxHN0FZdWweAQOA5tVZ7hrj/Lch028gy+WeuRlKQALDEIgpfXfA+UdvnEkChRAwACgEazMyxfEvj6bfRLZuhsZqKYEkCNyJlTGv/6VJWKuRlREwAKgMfXUF4/hfROkfQ2IO/+dXp4klS0ACYwj8he2Y1//mMfvdlEDuBAwAckda3wxx/C9Gu3D8H0AWqK+maiaBJAmcj9Vvxfnfl6T1Gl06AQOA0pGXXyCOPz7aE4P73o/o+MuvAkuUwGQEfskJ78T5O7XvZKQ8nhsBA4DcUNYvIxx/zNWfOf7566ehGklAAhD4X+RDOH/f8bc5lErAAKBU3OUUhuOPufo/jrwPidf7TBKQQP0IzEKlT+P4v1g/1dQoBQIGAC2qZRz/kpjzCWQfRMfforrVlNYReBiL9sD5n9A6yzSoMQQMABpTVeMriuNfiqOZ43dU//ioPCKBOhC4DiXiU75X10EZdUiXgAFAg+sex7806n8SeS+i429wXap6MgROwdJdcf4PJmOxhtaWgAFAbaumt2I4/Skc2RyJbv5tkXkQkwQkUG8C8bz/c8hncf6xbpJA5QQMACqvgv4UwO/HwL69kPciL+/vKs+SgARqQCCm9d0dv//rGuiiChKYTcAAYDaK+q3g9ONrjW9C4td+zNdvfQHBJIEGEYiZ/eJ5/58bpLOqJkJAh1LDisbxx2j+dyPxa385xCQBCTSPwImoHL/8H2qe6mqcAgEDgJrUcufX/haoE7/24+M81k1N6kY1JDAggXjGfzByCM7f5/0DwvP08gjoZMpj3bMkHH+M5M9+7S/b8yR3SkACTSEQv/Z3w++f1BSF1TNdAgYAFdQ9Tn8xit0K2RHZEpkbMUlAAs0mcBHqxyt+1zfbDLVPhYABQEk1jdNfkaJiIF/IBohOHwgmCbSAQMzhH9P5fhbnP7MF9mhCIgQMAAqq6M4z/TeQfbyrH07/VQUVZbYSkEB1BG6j6OjyP7s6FSxZAsMRMAAYjlvPq3D6Mf/+5kg4/RjIF1/jM0lAAu0k8HPM2hfn/0A7zdOqthMwABixhnH6LyGLcPbh9OOdfT/CAwSTBFpMID7k80Ec/1EttlHTEiBgADBgJePwF+SStZB1kXD8ayMxYY9JAhJoP4ELMTEG+t3QflO1sO0EDAAmqGGcfQzUWxUJJ59JPMvX4QPBJIGECMRAv0ORg3H+DvRLqOLbbKoBQFft4vBfymY4+hi8F8s1kQUQkwQkkC6BWzE9Bvqdky4CLW8jgWQDgE5Xfjj47Jd9LJdqYyVrkwQkMDSBn3DlB3D+DvQbGqEX1pVAqwMAnPzzAf8yZPmOLNdZrsLSrnwgmCQggZ4E4vW+/XD8J/c86k4JtIDAFGxYHLmfhv5E0+zBwUcAswwy1sFn2/EJ3bDRJAEJSKAfAvGs/9vIp7gnxmd8TRJoLYFwoDEt7Y9wptEdfjdy1yTLezj+GPIE/yAjf+iCcmNA3fxIPGufTBblnO5f9PHMPgbqmSQgAQmMSuBqMtib29r5o2bk9RJoAoEpmQ/HEW+Pwl9FBvkgzQzOD3m8I9l6toz9sR5pPOfue/PP8PGvBCRQDYHo/fwCcij3w8b1hFaDzFLbQGB2ABDGEATEL/FPIf+JPA8xSUACEmgzgWkY914cf/z6N0kgKQLPCgAyywkEVmD960hMdGOSgAQk0DYC8Xz/08i3cP7x3N8kgeQI9AwAMgoEAlux/g0kAgKTBCQggTYQOAUj3o/jj5H+JgkkS2DCGe34B4l/lFWRzyCPJktJwyUggTYQuBMjduG+trXOvw3VqQ2jEpiwB6A7c3oDYnDgYcgO3ftdl4AEJFBzAjEYOe5dX8TxP1xzXVVPAhLawMAAAAkuSURBVKUR6DsAyDQiENic9W8iMZmOSQISkEBdCcRryscin8Txx3S+JglIoIvAhI8Aus6bvco/0ulsrI58DHGijNlkXJGABGpEIEb3r8f96p06/xrViqrUisDAPQDd2tMbsCTbX0J2697vugQkIIGKCNxCufGLP375myQggQkIjBQAZPkSCGzA+heR9bN9LiUgAQmUSCCe7cdkPl/F+cczf5MEJDAJgVwCgKwMAoE3sX4wsm62z6UEJCCBAgnEO/w/QA7E8ccof5MEJNAngVwDgKxMAoEtWI9AID6xa5KABCRQBIEzyXR/HP9lRWRunhJoO4GBBwH2A4R/yNOQdTg3JhK6uJ9rPEcCEpBAnwRigN+bucdspvPvk5inSaAHgUJ6AMaWQ49ATCl8EPL6scfcloAEJNAngfM472Cc/u/7PN/TJCCBCQiUEgBk5RMIbMP6Qchrs30uJSABCUxC4FyOh+OPV5BNEpBATgRKDQAynQkE3sb6QUjMJ2CSgAQk0IvA2ewMxx/P+k0SkEDOBCoJAMIGgoApLLZDDkJeg5gkIAEJBIGpSDj+WJokIIGCCFQWAGT2dAKB7dn+LPLqbL9LCUggOQJnYfFBOP745W+SgAQKJlB5AJDZ1wkEdmT7QMRAIAPjUgLtJxDP9g/B8Z/TflO1UAL1IVCbAKAbCcHAJmx/ANkWeW73MdclIIFWEIjZ+n6CfBPH73v8rahSjWgagVoGABlEAoGlWd8X2RtZItvvUgISaCyB29H8W8j3cPz3NtYKFZdACwjUOgDI+BIIzMP625HoFXhjtt+lBCTQGALxDn98RvwEHP/MxmitohJoMYFGBADd/AkG4o2BCAR2QxboPua6BCRQKwIz0Ca+yhfd/JfUSjOVkYAE5mpcAJDVGYHAIqzvgeyHrJTtdykBCVRO4K9o8B3kCBz/3ZVrowISkEBPAo0NALqtIRjYnO0IBGKmwbm7j7kuAQmURuACSopu/l/g+J8srVQLkoAEhiLQigAgs5xAYBnWs0GDL8n2u5SABAojEL/2f4wcjdO/srBSzFgCEsidQKsCgIwOgcC8rO+ARK/A+tl+lxKQQC4EHiWXXyFHIWfg+J/KJVczkYAESiXQygCgmyDBwPJs74S8A/EjRN1wXJdA/wRmceofkKOR6OL/R/+XeqYEJFBHAq0PALqhEwy8gu0sGPD7A91wXJdAbwJ/YfcxITj9W3uf4l4JSKCJBJIKALoriGBgFbazYCDWTRKQwDME7mMRr+/Fc/0LhSIBCbSTQLIBQHd1EgxEb0AWDEQvgUkCqRH4OwafgvwSORXH/0RqALRXAqkRMAAYU+MEAzFOIIKBkJePOeymBNpEILr3T+zINJy+g/naVLvaIoFJCBgATACIYGAtDmfBwLITnOohCTSBQDj4c5GTkBNx+Nc1QWl1lIAEiiFgANAHVwKBKZy2DhKfK34z4pgBIJgaQeAhtPwtEk4/uvbj+b5JAhKQQHOnAq6y7ogHlqT8TTuyGcuXVamPZUtgDIFb2I6u/XD6U3H6zso3BpCbEpDAXAYAeTQCAoIYKxCBQBYUvCSPfM1DAn0SuIPzpiLxnn44fLv2AWGSgAQmJuAjgIn5DHy087hgVS7MAoKNWI8PF5kkkBeB28hoKpI5/Bvyyth8JCCBdAgYABRc1wQEc1PE65EsIIipiecruFizbxeB6NKfimQO/6Z2mac1EpBAFQQMAEqmTkDwPIpcD4nHBREUxJsGz0VMEsgI3MhKOPvM4UcAYJKABCSQKwEDgFxxDp5ZJyB4NVeu3pE1WK6GLIqY2k0gBuddjUzvkst4hn9/u83WOglIoA4EDADqUAs9dCAwiDcLIhjoDgyWZ3tKj9PdVX8CD6LiZUg4+0s7y6tx9s64BwyTBCRQPgEDgPKZD10iQcFCXBy9A92BQUxj7JiCoakWcuGt5Nr9q346jt7n9oWgNlMJSGBYAgYAw5KryXUEBTHIML5fED0FWWAQjxSWQuKYKX8CM8gyHHo8qw+JUfjZ+o04+0fZNklAAhKoNQEDgFpXz/DKdQKDJcjhpcgynWWsd0sECfMgpjkJ3M2u2U6d9W4nfwdOftacl7hHAhKQQHMIGAA0p65y15Qg4TlkujjSHRSMDRiW5vi8uRdefoYzKTK+eHdvl9zTY/1O9sWv+IdZmiQgAQm0loABQGurNh/DCBJi0OGLkQgMFkNivEHI/F3r2b5Bltn1WQ9E/KKOAXEh0cWerU+23X1uDLQLB9/LsT/gr3bImCQgAQl0CBgA2BQqJdB5VPEcnHO8EmeSgAQkIIGSCBgAlATaYiQgAQlIQAJ1IhDPgE0SkIAEJCABCSRGwAAgsQrXXAlIQAISkEAQMACwHUhAAhKQgAQSJGAAkGCla7IEJCABCUjAAMA2IAEJSEACEkiQgAFAgpWuyRKQgAQkIAEDANuABCQgAQlIIEECBgAJVromS0ACEpCABAwAbAMSkIAEJCCBBAkYACRY6ZosAQlIQAISMACwDUhAAhKQgAQSJGAAkGCla7IEJCABCUjAAMA2IAEJSEACEkiQgAFAgpWuyRKQgAQkIAEDANuABCQgAQlIIEECBgAJVromS0ACEpCABAwAbAMSkIAEJCCBBAkYACRY6ZosAQlIQAISMACwDUhAAhKQgAQSJGAAkGCla7IEJCABCUjAAMA2IAEJSEACEkiQgAFAgpWuyRKQgAQkIAEDANuABCQgAQlIIEECBgAJVromS0ACEpCABAwAbAMSkIAEJCCBBAkYACRY6ZosAQlIQAISMACwDUhAAhKQgAQSJGAAkGCla7IEJCABCUjAAMA2IAEJSEACEkiQgAFAgpWuyRKQgAQkIAEDANuABCQgAQlIIEECBgAJVromS0ACEpCABAwAbAMSkIAEJCCBBAkYACRY6ZosAQlIQAISMACwDUhAAhKQgAQSJGAAkGCla7IEJCABCUjAAMA2IAEJSEACEkiQgAFAgpWuyRKQgAQkIAEDANuABCQgAQlIIEECBgAJVromS0ACEpCABAwAbAMSkIAEJCCBBAkYACRY6ZosAQlIQAISMACwDUhAAhKQgAQSJGAAkGCla7IEJCABCUjAAMA2IAEJSEACEkiQgAFAgpWuyRKQgAQkIIH/D3oDcFD+iW2WAAAAAElFTkSuQmCC'/%3E%3C/defs%3E%3C/svg%3E)